
Figure 7. Recruitment and Survival of Ag-Specific CD8+T Cells during VSV-OVA Infection.
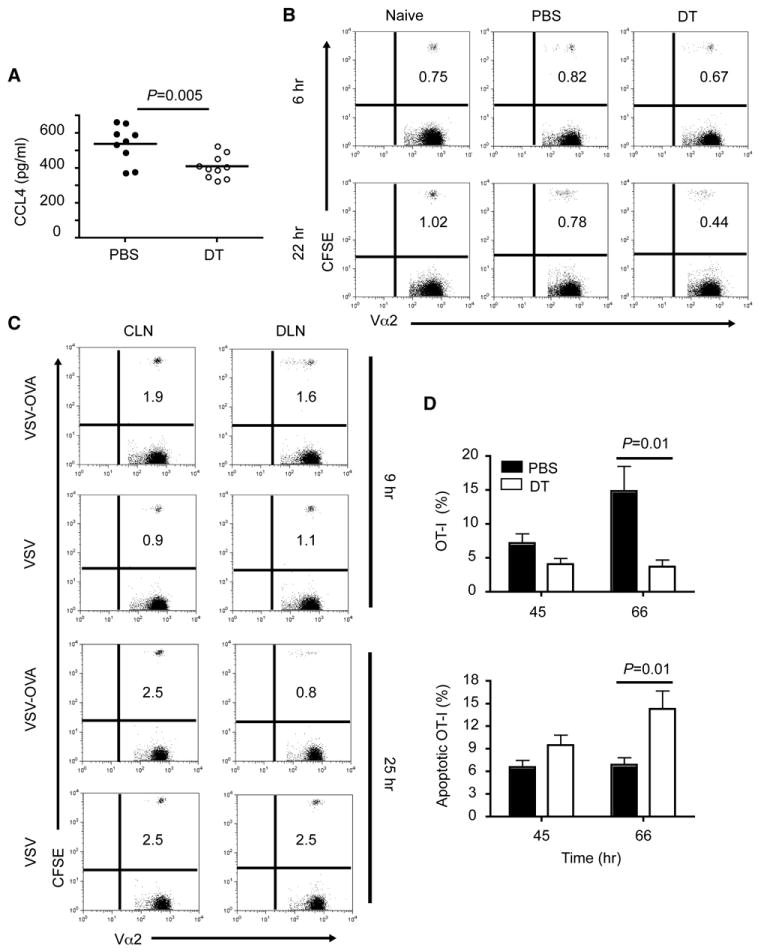
(A) Serum concentrations of CCL4 in VSV-OVA-infected mice 24 hr p.i. Data are from three experiments.
(B) Purified CD8+ T cells from OT-I TCR Tg mice were CFSE labeled and adoptively transferred into BDCA2-DTR Tg mice. Mice were depleted and infected as described in Figure 6. Splenocytes isolated at6or22 hr p.i. were stained with anti-Vα2then analyzed by flow cytometry. Dot plots show the frequencies of CFSE+ cells among Vα2+ cells. Data are representative of three to eight mice per group.
(C) Mice were injected with 2 × 10⁶ CFSE-labeled CD8+ T cells from OT-I mice then infected in the footpad with VSV or VSV-OVA (1 × 10⁶ pfu) 24 hr later. Controlateral (CLN) and draining (DLN) lymph nodes were stained with anti-Vα2 and analyzed by flow cytometry at 9 or 25 hr p.i. Data are representative of three mice per group.
(D) Mice were injected with CFSE- or eFluor 670-labeled OT-I cells, then depleted or not and infected as described in Figure 6. Splenocytes were stained with anti-CD8, anti-Vα2, and Annexin V or CaspACE FITC-VAD-FMK 45 or 66 hr p.i. Bar graphs show the frequencies of OT-I cells among CD8+Va2+ cells (top) and frequencies of apoptotic OT-I cells (bottom). Data are from two experiments (mean ± SEM, n = 4–8).
p value, unpaired, two-tailed Student's t test.