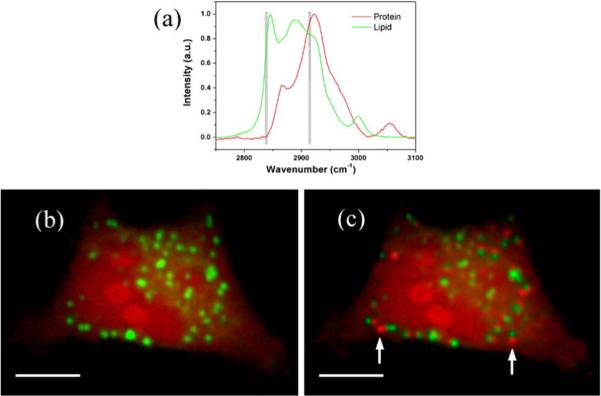
Fig.3.

(color online) (a) Spontaneous Raman spectra of protein and lipid. (b) Reconstructed SRS image by line-by-line tuning, free of spectral artifacts due to lipid droplet driftings. (c) Reconstructed SRS image by frame-by-frame tuning. The two arrows point to artifacts due to lipid droplet driftings. Red: protein, green: lipid. Both images are 460×318 pixels. The scale bar is 10 μm. (60×water objective lens used)
