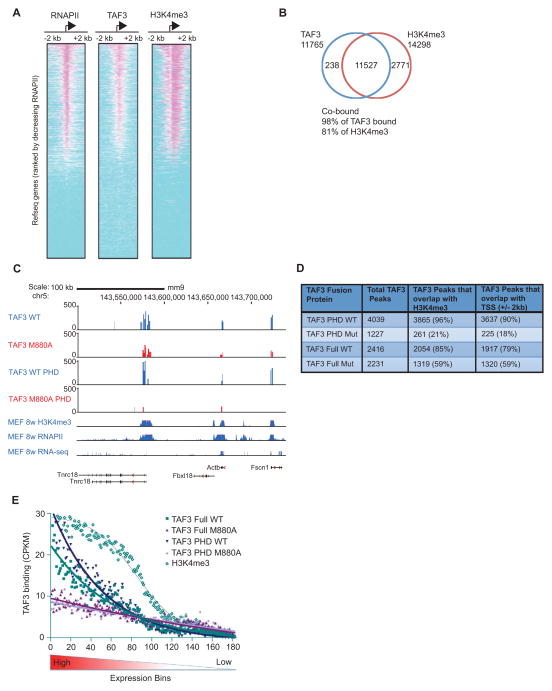
Figure 1. H3K4me3 Facilitates Global TAF3/TFIID Recruitment.
(A–B) ChIP-Seq and (C–E) HIT-seq analyses. (A) Heat maps showing the distributions of RNAPII, TAF3, and H3K4me3 within 2 kb of the TSSs of 17,347 Refseq genes, rank-ordered by the size of RNAPII peaks. (B) Venn diagram showing the overlap of genes occupied by TAF3 and enriched for H3K4me3 (p<1E-05, FDR <5%). (C) HIT-seq signals for full-length WT and M880A mutant TAF3 and the corresponding isolated PHD TAF3 proteins at the indicated loci as compared to the distributions of H3K4me3, RNAPII, and expressed RNAs from published datasets (Shen et al., 2012). (D) HIT-seq binding sites with the total integrations including: TAF3 WT (22,844), TAF3 M880A mutant (39,695), TAF3 PHD WT (26,087), and TAF3 PHD M880A mutant (35,363). The number of TAF3 peaks that overlap with H3K4me3 or the TSS (+/− 2 kb) are shown. (E) Line graph showing the distribution of WT and mutant TAF3 binding sites (for both full-length and isolated TAF3 PHD proteins) and the distribution of H3K4me3 (Shen et al., 2012) relative to gene expression levels. ~18,000 mouse Refseq genes were separated into bins of 100 based on expression level. The binding sites associated with the genes in each bin were enumerated and adjusted for the genome size in each bin and the binding activity was normalized and calculated as counts per kb per million tags (CPKM). See also Figure S1.

