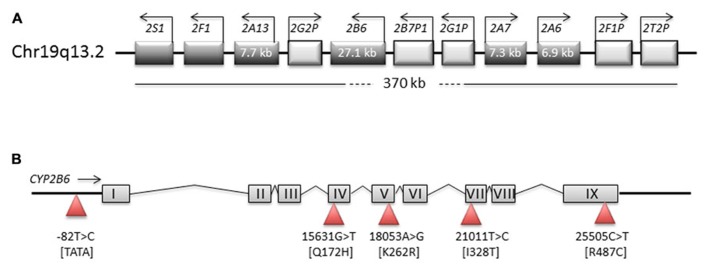
FIGURE 1.
Structure of genomic regions on chromosome 19. Schematic representation of the CYP2ABFGST-cluster on chromosome 19 (A) and of the CYP2B6 gene (B). Boxes in the (A) represent genes, with direction of transcription indicated by arrows. The (B) represents CYP2B6 exons and introns and shows the most important SNPs as triangles.

