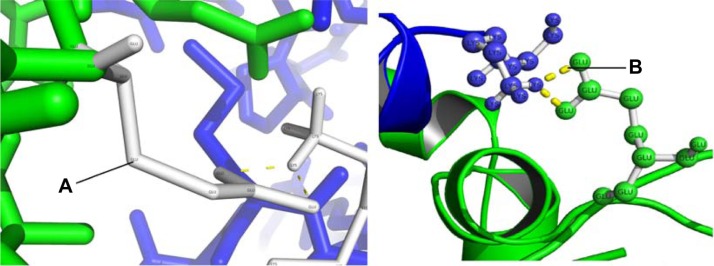
Figure 3.
Interaction between the NH2-terminal intracellular β1 and the S0–S1 intracellular loop; and between the S3–S4 extracellular loop of the α subunit and TM2 of the β1 subunit. The α and β1 subunits are shown in green and blue, respectively. (A) Glutamic acid 147 (B) Lysine 3 interacting both by polar contacts, hydrogen atoms from the Glutamic acid structure interacting with the Lysine polar interactions are shown as dotted lines.

