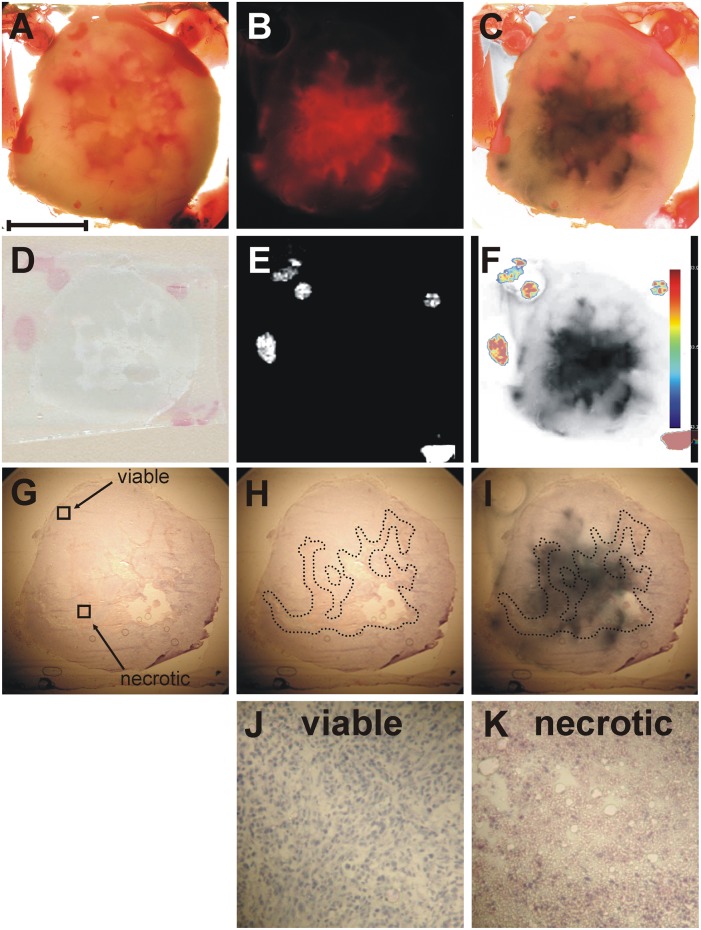
Fig. 1.
Co-registration of optical microscopy and mass spectrometric imaging. A: Representative bright-field image of a 2 mm-thick fresh breast tumor tissue section embedded in gelatin containing fiducial markers. B: Corresponding fluorescence image of tdTomato expression in the hypoxic tumor regions. C: Coregistration of the bright-field image shown in A and the fluorescence image shown in B based on the position of the fiducial markers present in both images. The red color of the tdTomato signal was changed to black prior to generating this overlay for better visualization of the hypoxic tumor regions. D: Corresponding optical image of a thin tissue section used for MSI. E: Corresponding MSI image of the fiducial markers. F: Coregistration of fiducial markers imaged by MSI and the hypoxic regions imaged by fluorescence microscopy. G: Image of the adjacent H and E-stained tissue section. H: Image of the outlined necrotic tissue present inside the tumor. I: Coregistration of the necrotic region visualized by H and E staining and the hypoxic region imaged by fluorescence microscopy. J: Magnified image of viable tumor region as indicated in G. K: Magnified image of necrotic tumor region as indicated in G. Scale bar, 5 mm A–I; 250 µm J–K.

