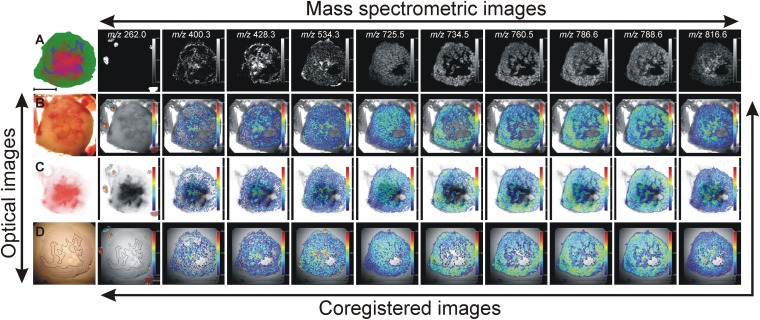
Fig. 6.
Multimodal imaging combining optical microscopy to visualize different tumor microenvironments and mass spectrometric imaging to localize multiple lipid molecular ions. Optical images: A: Diagram showing the localization of viable (in green), necrotic (in blue) and hypoxic regions (in red) in a representative MDA-MB-231-HRE-tdTomato breast tumor section. B: Bright-field image of the corresponding fresh tumor section and fiducial markers visible as red points. C: Image of the hypoxic region obtained by fluorescence microscopy of tdTomato. The black background has been removed for better coregistration with MSI. D: H and E-stained image of a tumor section obtained from the fresh section shown in B. The necrotic region present in the tumor center has been outlined. The empty hole within this section originated from loss of tissue integrity in a small part of the necrotic tumor region. Mass spectrometric images from left to right: [M-CH3COO−]+ of fiducial markers at m/z 262.0, [M+H]+ of palmitoylcarnitine at m/z 400.3, [M+H]+ of stearoylcarnitine at m/z 428.3, [M+K]+ of LPC(16:0/0:0) at m/z 534.3, [M+Na]+ of SM(d18:1/16:0) at m/z 725.5, [M+H]+ of PC(16:0/16:0) at m/z 734.5, [M+H]+ of PC(16:0/18:1) at m/z 760.5, [M+H]+ of PC(18:1/18:1) at m/z 786.6, [M+H]+ of PC(18:0/18:1) at m/z 788.6, and [M+H]+ of PC(16:0/22:1) at m/z 816.6. Coregistered images: The mass spectrometric images in the top row were coregistered with the optical images in the left column based on the position of the fiducial markers. Scale bar, 5 mm.

