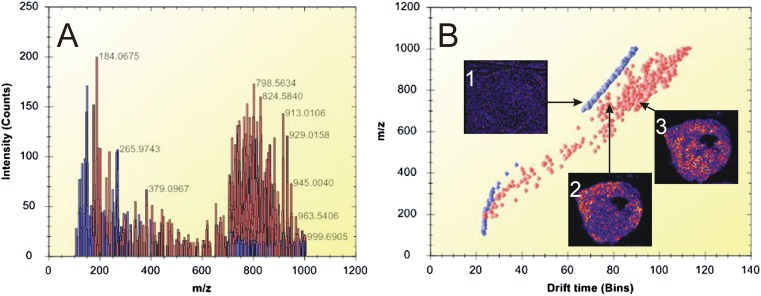
Fig. 8.
IMS of biomolecular ions detected from thin tumor tissue sections. A: Representative spectrum of peak-picked data acquired during an IMS imaging experiment. The lipid peaks are highlighted in red, whereas matrix-related ions are shown in blue. B: Drift plot of the separated ions. Ion image 1 shows the distribution of a background matrix ion. Ion images 2 (m/z 746.5) and 3 (m/z 746.6) show the distribution of different lipids in the tumor tissue. Lipid-related ions (highlighted in red) were separated from background ions (blue).

