Fig. 5.
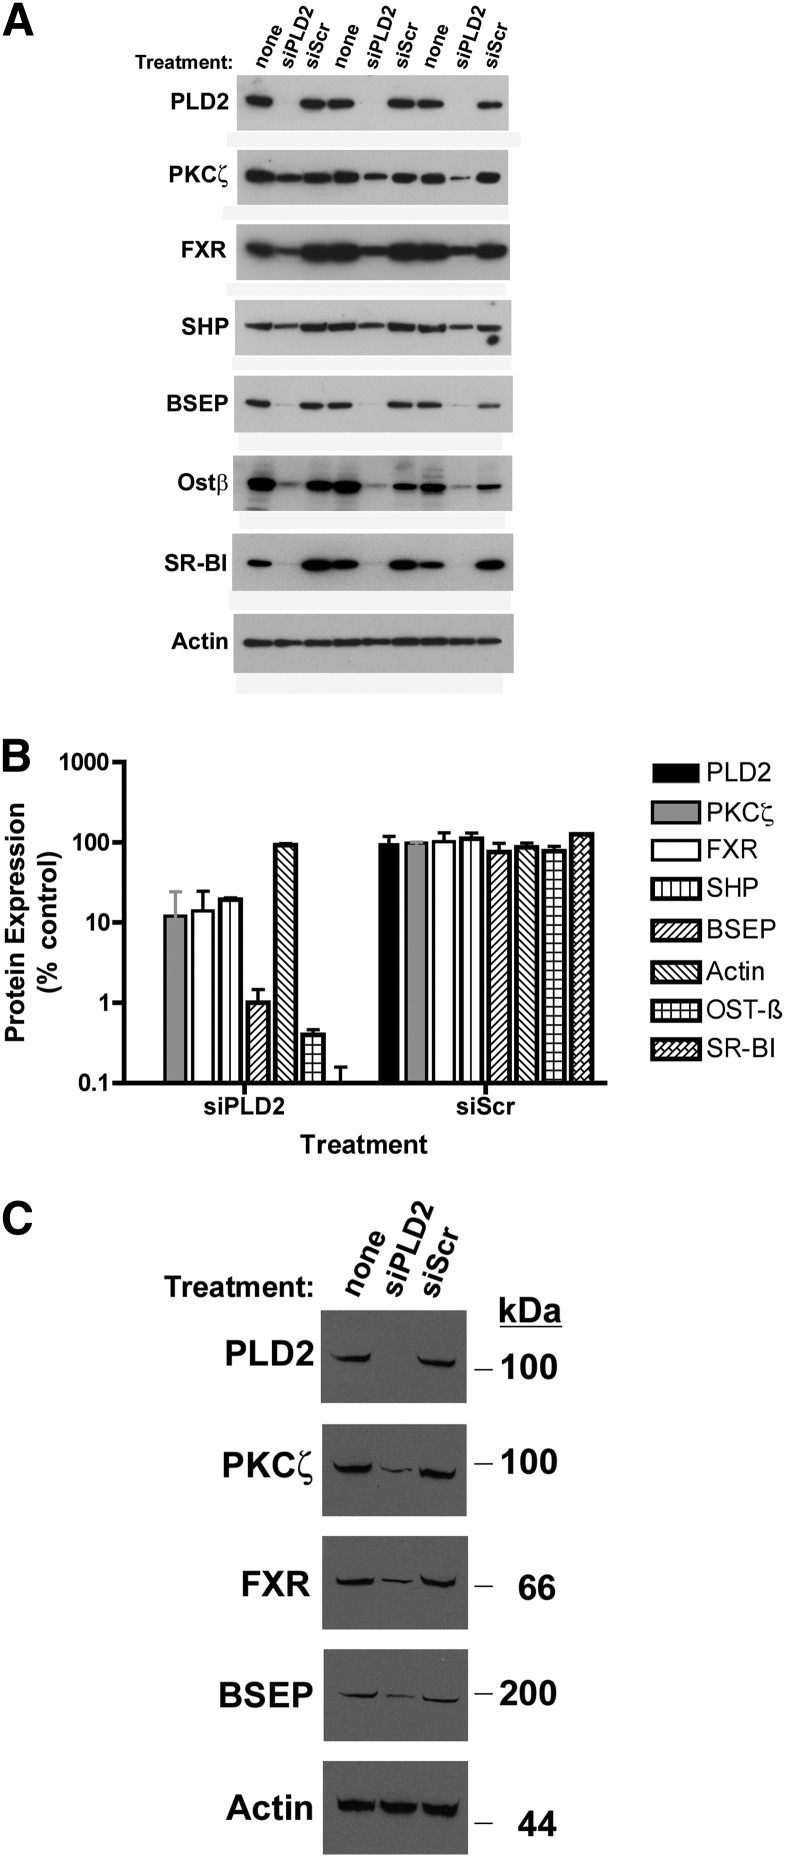
Effect of PLD2 silencing on hepatocyte protein expression. A: Western blot analysis of PLD2 silencing in HepG2 cells. Three separate sets of experiments are shown. Cells were untreated (none) or treated with siPLD2 or a scrambled control (siScr). Total cellular homogenates were probed for PLD2, PKCζ, FXR, SHP, BSEP, Ostβ, SR-B1, and actin (loading control). Densitometric quantification of band intensity is shown below each band. B: Depiction of statistical analysis of Western blotting of HepG2 cells. Protein levels are expressed as a percentage of the untreated cells. Bars represent the mean for each protein; error bars are SD. With the exception of actin, all of the proteins were reduced by a significant amount compared with either untreated cells or siScr-treated cells. C: Western blot analysis of PLD2 silencing in freshly isolated human hepatocytes.

