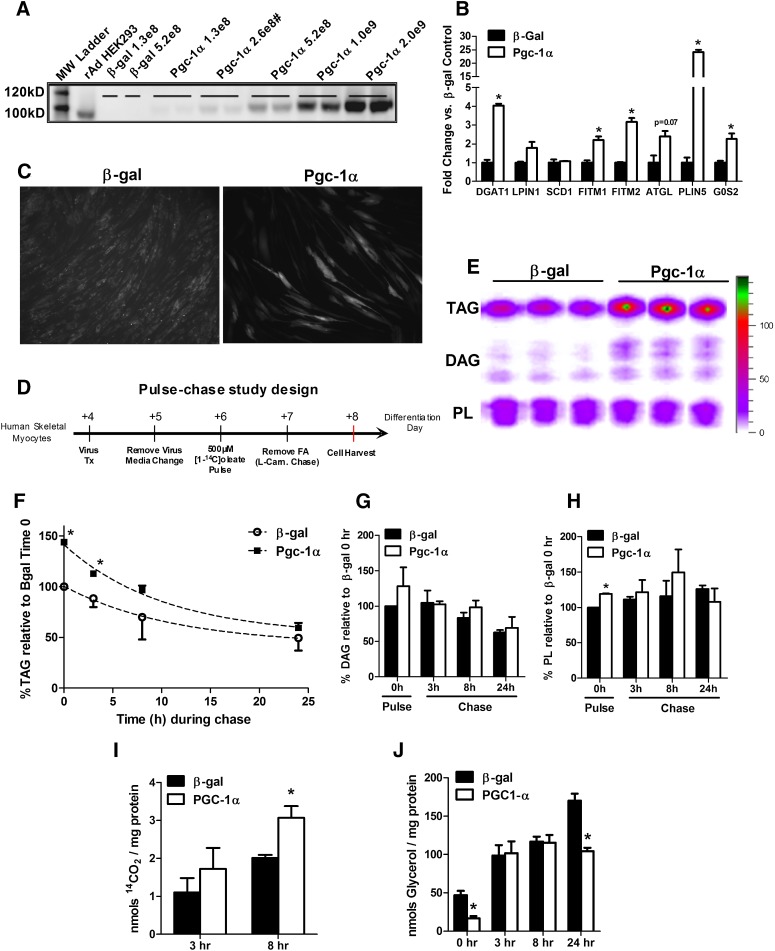
Fig. 4.
Overexpression Pgc-1α affects lipid droplet metabolism in primary human skeletal muscle myotubes. (A) Western blot analysis of mouse Pgc-1α protein abundance in differentiation day 7 human skeletal myotubes. Cells were harvested 72 h after transduction with increasing doses (PFU/cm2) of adenoviruses expressing β-galactosidase (β-gal) or mouse Pgc-1α. (#) denotes the dose used for subsequent gene expression and pulse-chase studies. (B) mRNA expression analysis of myotubes harvested 72 h after virus treatment. Data are means ± SEM for triplicate wells from two independent experiments analyzed in triplicate and normalized to 18 s. (C) Day 4 myotubes were exposed to media containing 100 µM oleate/palmitate (1:1) bound to BSA at a 5:1 ratio for 72 h. Neutral lipids were stained using AdipoRed and visualized by fluorescent microscopy. (D) Schematic representation of the pulse-chase experimental design. L-carnitine (0.5 mM) was present only during the chase. (E) Representative radiogram of myotube lipids measured at the end of the 24 h pulse showing incorporation of [1-14C]oleate into TAG, DAG, and phospholipids (PL). Quantitation of [1-14C]oleate-labeling of (F) TAG, (G) DAG, and (H) PL during the pulse-chase experiment. Cells were harvested in 0.1% SDS lysis buffer at times 0 (immediately after the 24 h pulse), 3, 8, and 24 h during the carnitine chase. (I) 14CO2 production and (J) glycerol release into the medium at 3 and 8 h during the carnitine chase. Data are means ± SE of two independent experiments performed in triplicate and expressed as a percentage relative to levels in cells treated with β-gal virus at time 0 (the end of the pulse period). In (F–J), data are normalized to total cellular protein per well. *P < 0.05 versus β-gal treated control cells at the same time point.

