Figure 5.
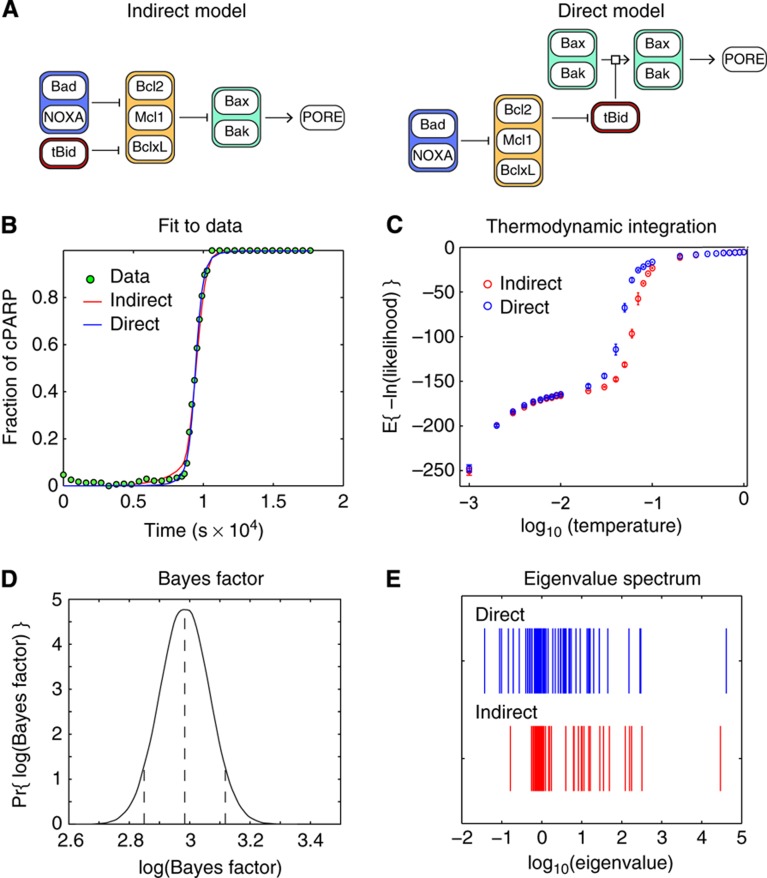
Discriminating between direct and indirect models of mitochondrial outer membrane permeablization. (A) Graphical depictions of potential indirect and direct mechanisms controlling pore formation by Bax and Bak. See text for details. (B) Both EARM1.3I indirect (red) and EARM1.3D direct (blue) models exhibited an excellent fit to experimental EC-RP trajectories. Thus, the models cannot be distinguished by simple maximum likelihood criteria. For simplicity, simulations were based on a single best-fit parameter vector. (C) Thermodynamic integration curves for the direct and indirect model. (D) Exponentiation of the differential area in the two thermodynamic curves from C provides an estimate of the Bayes factor for direct and indirect models along with the uncertainty in the estimate. On the basis of the distribution of the Bayes factor estimate (reflected in the error bars in C) the direct model is preferred to the indirect by a weight of ∼20, with the 90% confidence interval spanning a range from 16 to 24. (E) Eigenvalue analysis of the landscape around the respective maximum posterior fits shows the direct model (blue) has multiple smaller eigenvalues, suggesting that it is consistent with the data over a larger volume of parameter space and therefore exhibits greater statistical weight.

