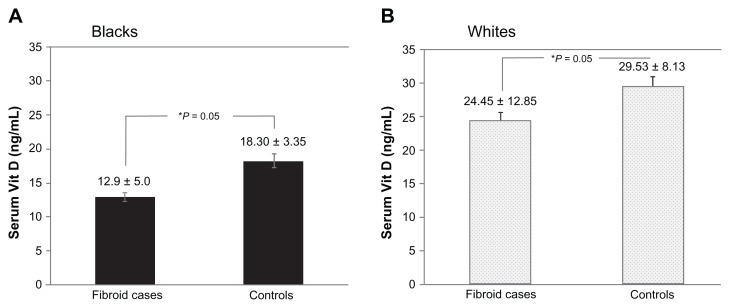
Figure 2.
Comparison of serum 25-(OH) vitamin D (Vit D) levels between cases and controls in different ethnic groups: Vit D levels in (A) blacksa and (B) whites.b
Notes:aUterine fibroid cases, n = 61; healthy controls, n = 26; buterine fibroid cases, n = 43; healthy controls, n = 24; *statistically significant (P ≤ 0.05).

