Figure 1.
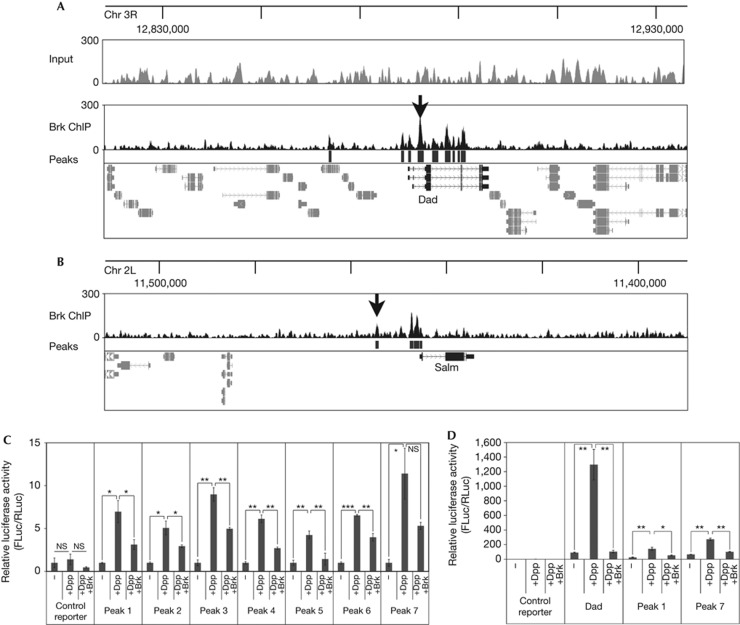
ChIP-Seq of endogenous Brk from larval wing discs. (A,B) ChIP-Seq of endogenous Brk from larval wing discs identifies known Brk binding sites (black arrows) near Dad (A) and Salm (B). Brk binding peaks (black boxes below ChIP-seq trace, ‘Peaks’) identified by PeakSeq relative to normalized input with cutoff P<10−10. ChIP profiles displayed using UCSC genome browser [37]. (C) Luciferase reporter assays on randomly selected Brk ChIP-Seq peaks showing activation by Dpp signalling and repression by Brk. Peaks 1–7 are all the Brk ChIP-Seq peaks on chromosome X between positions 5,590,283 (Peak 1) and 5,795,911 (Peak 7), detailed in supplementary Materials online. Regions were cloned into a firefly luciferase reporter with a basal Hsp70 promoter (‘control reporter’) and assayed relative to a renilla luciferase normalization control. S2 cells were co-transfected to express activated Thickveins+Mad+Medea to activate Dpp signalling (‘+Dpp’) and Brk (‘+Brk’). Values for each reporter are normalized to 1 for the ‘−’ condition n=3. (D) Luciferase assay with Brk ChIP regions #1 and #7 as in C, and a positive control reporter containing a genomic region from Dad. Error bars: standard deviation, *t-test ⩽0.05, **t-test ⩽0.01, ***t-test ⩽0.001. Brk, Brinker; Chr, chromosome; ChIP-Seq, chromatin immunoprecipitation sequence; NS, nonsignificant.

