Figure 2.
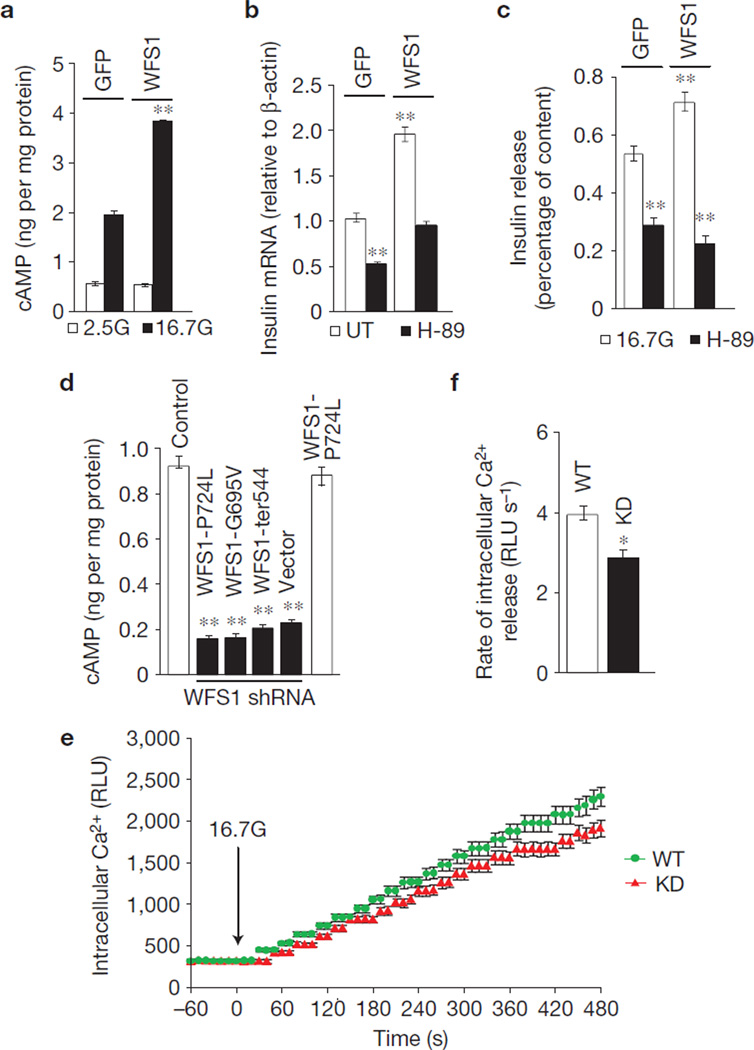
WFS1 modulates cAMP production. (a) Total cellular cAMP content was measured in lysates from rat islets transduced with GFP or WFS1 lentivirus, and treated for 2 h with 2.5 mM glucose (2.5G) or 16.7 mM glucose (16.7G). Cellular cAMP levels were normalized to total protein levels (n = 3). **P < 0.01 when compared with GFP (16.7G). (b) Total mRNA was prepared from islets generated the same as in a, treated with 16.7G or 16.7G with pre-treatment of 10 µM H-89 for 9 h. Relative expression levels of both rodent insulin gene isoforms, Ins1 and Ins2, were measured by quantitative PCR (Ins2 represented in figure; similar expression levels found for Ins1; n = 3). **P < 0.01 when compared with GFP (UT). (c) Insulin release was measured in islets generated the same as in a, treated for 2 h with 16.7G or 16.7G with 10 µM H-89. Insulin levels were normalized to total cellular insulin content (n = 3). **P < 0.01 when compared with GFP (16.7G). (d) Total cellular cAMP content was measured in lysates from INS-1 832/13 pTetR cells (Control), expressing the WFS1 disease mutant P724L or inducibly expressing shRNA against Wfs1 and stably expressing the following WFS1 disease mutants: P724L, G695V or ins483/ter544 (ter544), and treated with 2.5G or 16.7G for 2 h. Cellular cAMP levels were normalized to total protein levels and basal secretion subtracted from 16.7G (n = 3). **P < 0.01 when compared with control. (e) Intracellular calcium was measured in INS-1 832/13 pTetR cells with endogenous WFS1 expression (WT) or suppression of endogenous WFS1 with shRNA (KD) treated with 16.7G. (f) Intracelluar calcium release rate after 16.7G stimulation was quantified in WT and KD cells using the following formula: (t0 RLU–t480 RLU)/480 = RLU s−1 (n = 3). All data are means ± s.d. *P < 0.05, **P < 0.01.

