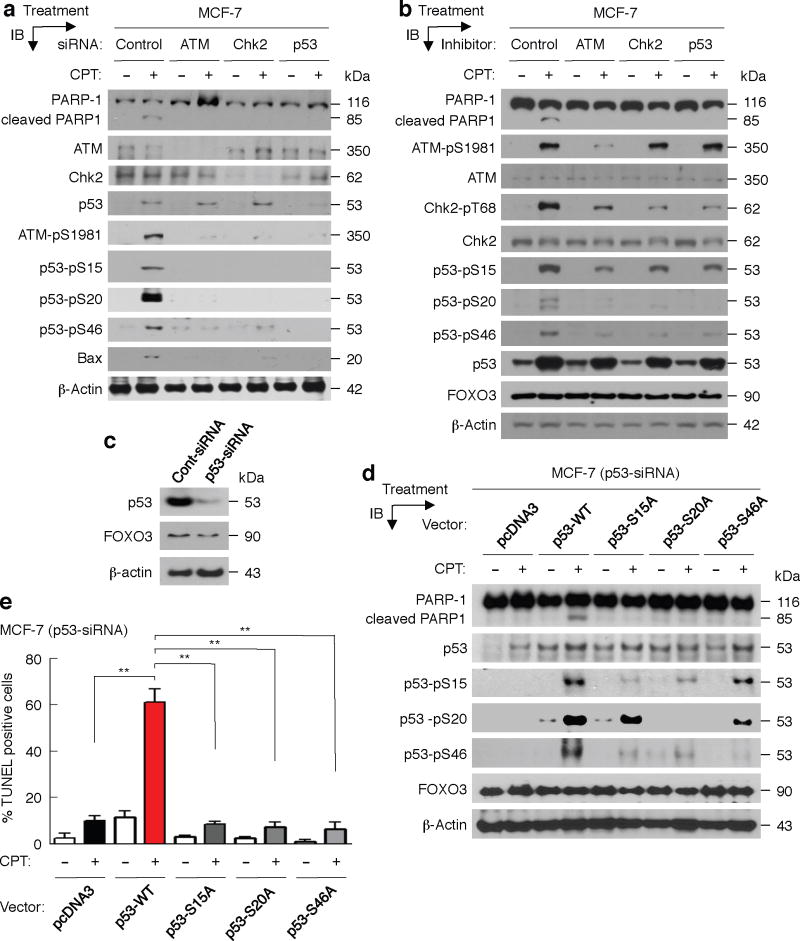
Fig. 5. Phosphorylated ATM-Chk2-p53 may be needed for FOXO3-mediated apoptosis.
(a) MCF-7 cells were transfected with control-siRNA (control) or siRNA (0.3 μM) targeting ATM or Chk2 or p53 and incubated for 48 hours (h), and then these cells were treated with CPT (1 μM) (+) or DMSO (−) for 48 h. Whole cell lysates were prepared from these treated cells and the levels of PARP-1 and its degraded proteins, ATM, Chk2, p53, and their phosphorylated proteins or a p53 target (Bax) were analyzed by IB with specific Abs as indicated or an anti-β-actin (loading control). (b) MCF-7 cells were first treated with ATM inhibitor (Mirin) or Chk2 inhibitor (NSC10955) or p53 inhibitor (Pifithrin), 20 μM/each, or DMSO for 6 h, and then treated with CPT (1 μM) or DMSO for 16 h. Whole cell lysates were prepared from these treated cells and the levels of PARP-1 and its degraded proteins, and the indicated proteins and β-actin were analyzed by IB analysis with specific Abs. (c) MCF-7 cells were transfected with p53-siRNA or Cont-siRNA (Control-siRNA) for 48 h. Whole cell lysates were prepared from these transfected cells and the expressions of p53 and FOXO3 (control) were determined by IB analysis with specific Abs. (d) MCF-7 (p53-siRNA) cells were transfected with pcDNA3 (control) or p53 wild-type (WT) or mutant (p53-S15A or p53-S20A or p53-46A) expression vectors (2 μg DNA/each) for 48 h, and then treated with CPT (1 μM) (+) or DMSO (−) for 48 h. Whole cell lysates were prepared from these treated cells and the levels of PARP-1 and its degraded proteins, and the indicated proteins were analyzed by IB analysis with specific Abs. (e) MCF-7 (p53-siRNA) cells were transfected with control and expression vectors for 24 h, the transfected cells were treated with CPT (1 μM) or DMSO control for 36 h, and cellular apoptosis was determined by TUNEL assays (Promega). Images of apoptotic cells were shown in Supplementary Fig. S9. An average (%) of TUNEL-positive (apoptotic) cells was determined and shown in the diagram. **, P= 0.0001.

