
Figure 2. Interlobe Rotation Induced by Peptide Binding.
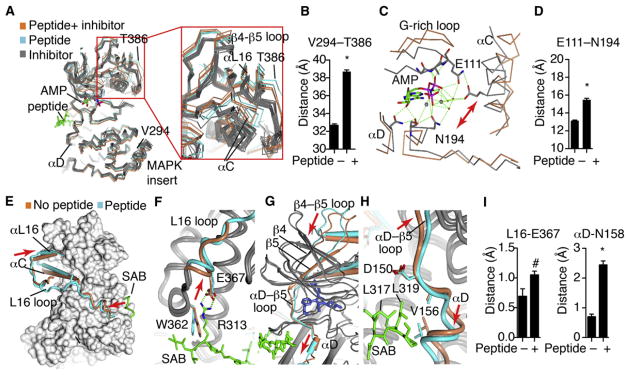
Statistical significance was measured with Student’s t test. *p < 0.0001; #p < 0.08.
(A) All published JNK3 structures (Tables S1A and S1B) were globally superimposed against JNK1.pdb (AMP bound with no peptide) and shown as α-carbon trace, including 24 structures with different inhibitors (gray), two structures with inhibitors+ peptide (cyan), and our three structures with peptides and no inhibitors (coral). Close-ups are also shown in Figure S2.
(B) The distance between the indicated residues in the MAPK insert or αL16 was measured for each structure, showing an opening of the lobes induced by peptide binding.
(C) The structure of JNK3 bound to AMP-PNP (gray, JNK1.pdb) was superimposed with our structure of SAB-bound JNK3 (coral). Shown are select residues in the catalytic site.
(D) The distance between the indicated catalytic site residues was measured for the set of peptide-bound versus peptide-free JNK3 structures, showing significant peptide-induced distortion of the catalytic site. Error bars represent SEM.
(E–H) The SAB/JNK3 structure (gray and cyan) was superimposed with the inhibitor bound structure, 1PMN.pdb (gray and coral). The peptide is shown as a green cylinder, and the inhibitor as spheres. (E) JNK3 is shown as surface, except for the indicated regions. The L16 loop (blue tube) connects the peptide with the altered position of αL16. In the peptide-free structure, (coral), the L16 loop is partially disordered. The peptide is green. Arrows indicate where the peptide pushes on the L16 loop, and where this is transferred to L16. (F) Detail of how the peptide pushes L16 to accommodate a salt bridge. (G) The peptides induce a “pull” in αD that is transmitted to β5 and the β4-β5 loop in the C-lobe. (H) Detail of the peptide-induced shift in αD and the αD-β5 loop.
(I) All the JNK3 structures were superimposed with JNK1.pdb as a reference structure. The distance of the α-carbon from the corresponding residue in JNK1 was measured. Error bars represent SEM.
See also Figure S2.