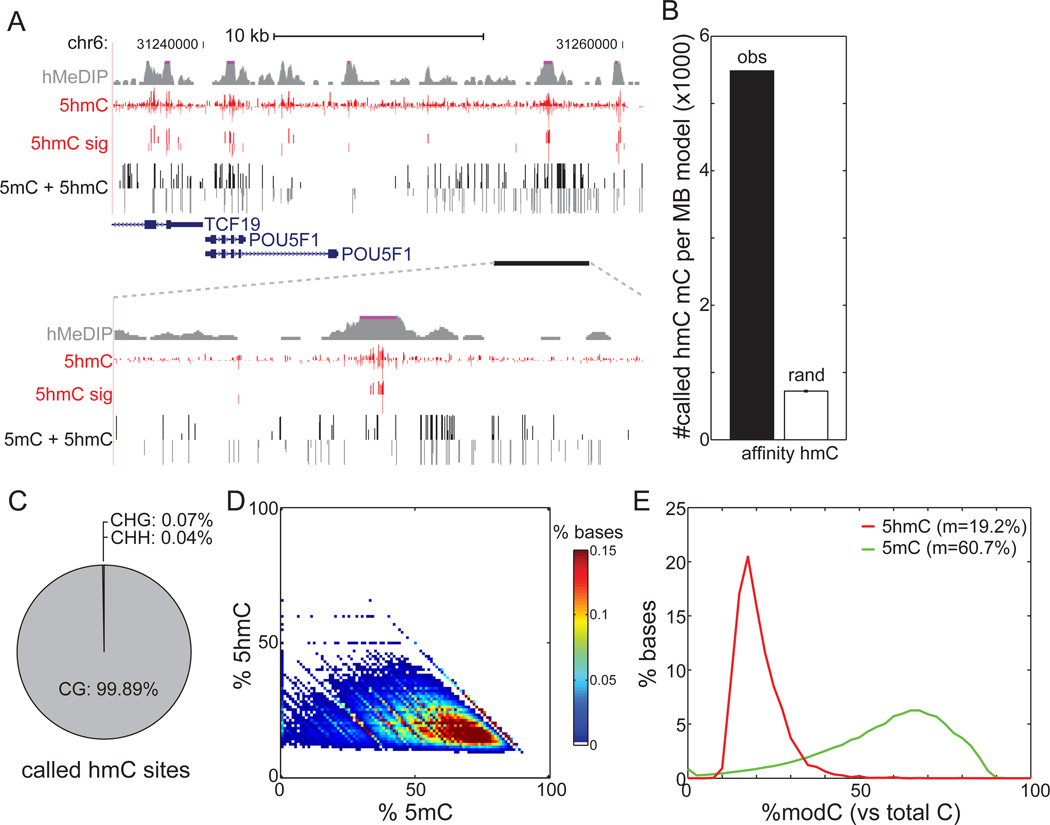
Figure 2. Generation of Genome-wide Base-Resolution Maps of 5hmC.
(A)Snapshot of base-resolution 5hmC maps (red) compared to affinity-based 5hmC maps (grey) in H1 cells near the POU5F1 gene. Also shown are base-resolution maps of traditional bisulfite sequencing in H1 cells (black). Positive values (darker shades) indicate cytosines on the Watson strand, whereas negative values indicate cytosines on the Crick strand. For 5hmC, the vertical axis limits are −50% to +50%. For traditional bisulfite sequencing, the limits are −100% to +100%. Only cytosines sequenced to depth ≥5 are shown.
(B) Overlap of 5hmC with 82,221 genomic regions previously identified as enriched with 5hmC by affinity mapping (black), in comparison to randomly chosen 5mC (white) (see Extended Experimental Procedures).
(C) Sequence context of 5hmC sites compared to the reference human genome.
(D)Heatmap of estimated abundances of 5hmC and 5mC for modified cytosines significantly enriched with 5hmC. 5mC was estimated as the rate from traditional bisulfite sequencing (5hmC + 5mC) minus the measured 5hmC rate.
(E) The distribution of estimated abundances of 5hmC (red) and 5mC (green) at 5hmC sites. m: median.
See also Figure S2.

