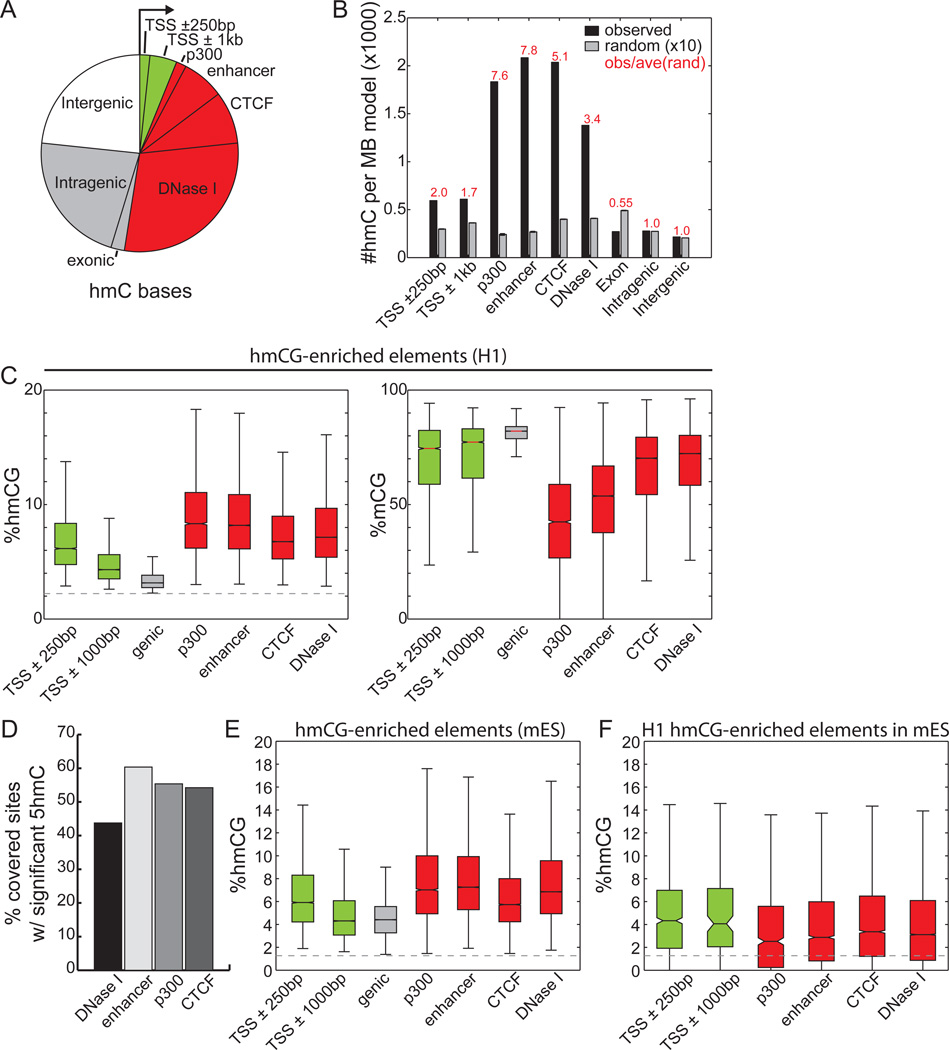
Figure 3. Genomic Distribution of 5hmC Sites.
(A)Overlap of H1 5hmC with genomic elements. Genic features were extracted from the UCSC Known Genes database (Hsu et al., 2006). Promoter-distal regulatory elements (>5kb from TSS) reflect those experimentally mapped in H1 cells from ChIP-Seq and DNase-Seq experiments. Each 5hmC base is counted once: the overlap of a genomic element excludes all previously overlapped cytosines counterclockwise to the arrow. Green: promoter-proximal; red: promoter-distal regulatory elements; grey: genic regions; white: intergenic regions.
(B) The relative enrichment of H1 5hmC (black) and random sites (grey) at genomic elements, normalized to the total coverage of the element type. Random consists of 10 random samplings of 5mC (see Extended Experimental Procedures).
(C) The levels of 5hmCG (left) and 5mCG (right) for several classes of genomic elements significantly enriched with 5hmCG in H1 (p = 0.01, binomial). The dotted line indicates the 5mC non-conversion rate. Colors as in (A).
(D)The percentage of distal regulatory elements significantly enriched with 5hmCG in H1.
(E) In mouse ES cells, the absolute level of 5hmCG for several classes of genomic elements significantly enriched with 5hmCG (p = 0.01, Fisher’s exact test). Colors as in (A).
(F) For genomic elements significantly enriched with 5hmCG in H1 ES cells and conserved in mouse, the distribution of 5hmCG in mouse ES cells. Colors as in (A).
In all panels, definitions of enhancers, p300, CTCF, and DNase I sites are promoter-distal (>5-kb from TSS).
See also Figure S3.

