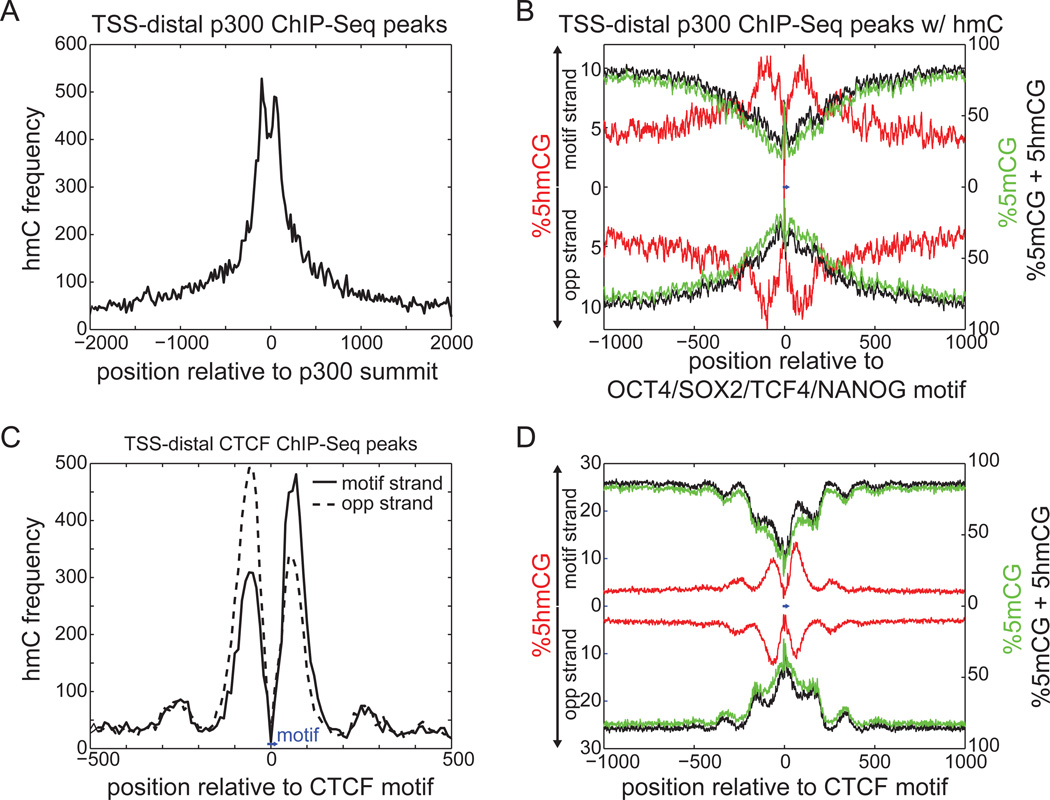
Figure 4. Profiles of 5hmC at Distal Regulatory Elements.
(A)Frequency of 5hmC around distal p300 binding sites.
(B) Absolute levels of 5hmCG (red) and 5mCG+5hmCG (black) around the distal p300 binding sites containing an OCT4/SOX2/TCF4/NANOG motif (blue bar, center; consensus: ATTTGCATAACAATG). 5mC (green) was estimated as the rate from traditional bisulfite sequencing (5hmC + 5mC) minus the measured 5hmC rate. The top half indicates enrichment on the strand containing the motif, with the bottom half indicating the opposite strand.
(C) Frequency of 5hmC around distal CTCF binding sites, relative to the CTCF motif (blue bar, bottom). The different lines represent different strands, oriented with respect to the CTCF motif (consensus: ATAGTGCCACCTGGTGGCCA). Opp, opposite.
(D) Absolute levels of 5hmCG, 5mCG, and 5mCG+5hmCG around distal CTCF binding sites anchored at the CTCF motif (blue bar, center). Colors as in (B).
See also Figure S4.

