Figure 1.
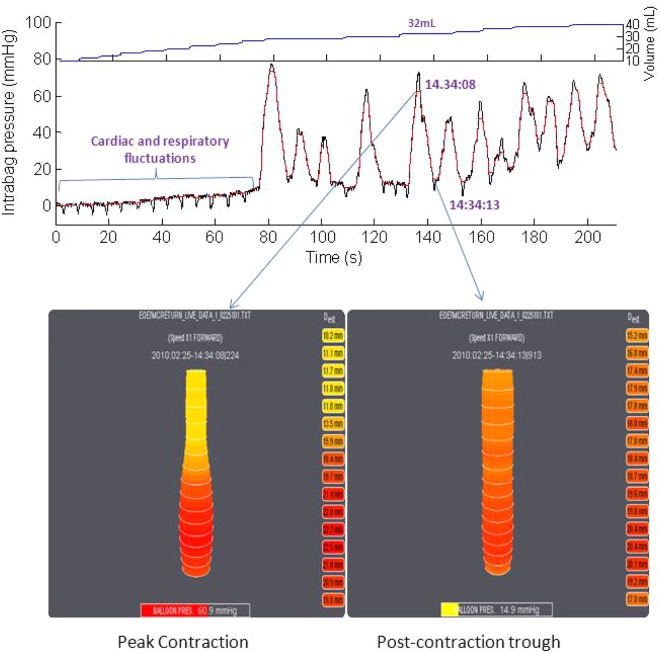
Examples of an EndoFLIP study in real time during volumetric distension. The top volume shows the volumetric distension increments, the middle panel the corresponding raw data signal of intrabag pressure and the lower panel representative esophageal diameter data at the peak of an esophageal contraction (left) and between contractions (right). Note the superimposed effects of vascular pulsations, respiration and especially esophageal contractions on the pressure signal. These extraneous signals affect the esophageal diameter data, evident by the fact that functional luminal imaging probe display images were both taken during the 32 ml distension. Esophageal contractions have an even more profound effect on calculations of distensibility, as the measurement units are mm2/mmHg and the intrabag pressure on the left panel is 60.9 mmHg while that on the right panel is 14.9 mmHg.

