
Figure 2.
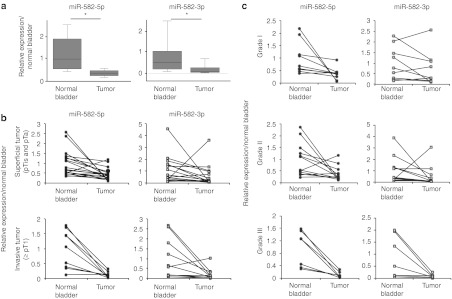
Expression level of miR-582-5p and -3p in bladder cancer tissue samples. (a) Expression of miR-582-5p and -3p in clinical samples, which show the downregulation in the tumor region compared with the adjacent normal tissues (tumor: n = 53, normal bladder: n = 31). The boxes and whiskers range from 25% to 75% and from 10% to 90%, respectively. *P < 0.01 versus normal bladder. (b) Comparison with the tumor stages in carcinoma cells paired with normal bladder tissue (superficial tumor: n = 18, invasive tumor: n = 10). (c) Comparison with the tumor grades in carcinoma cells paired with normal bladder tissue. All values for the miRNA expression levels were normalized to hsa-miR-103 as an internal control (Grade I: n = 9, Grade II: n = 12, Grade III: n = 7).