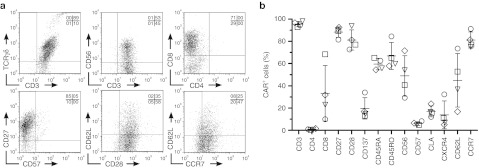
Figure 2.

Immunophenotype of electroporated, separated, and propagated CAR+γδ T cells. (a) Expression by flow cytometry of cell surface markers associated with T cells and memory as gated on CD3+CAR+ cells. (b) Percentages of CAR+ T cells expressing T-cell markers, where each shape represents a different donor. Data are mean ± SD (n = 4). Quadrant percentages of flow plots are in upper right corner. CAR, chimeric antigen receptor; TCR, T-cell receptor.
