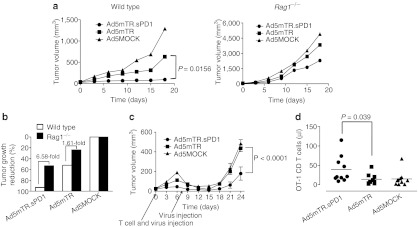
Figure 6.

Tumor growth suppression by sPD1-Ig in T and B cell–deficient Rag1−/− mice. (a) Subcutaneous E.G7 tumors in C57/BL6 mice were injected intratumorally with Ad5MOCK (closed triangle), Ad5mTR (closed square), or Ad5mTR.sPD1 (closed circle) (left panel). To measure lymphocyte involvement in the antitumor activity of sPD1-Ig, subcutaneous E.G7 tumors in Rag1−/− mice were injected intratumorally with Ad5MOCK (closed triangle), Ad5mTR (closed square), or Ad5mTR.sPD1 (closed circle) (right panel). Tumor growth was calculated and plotted at the indicated time points. P, unpaired t-test. (b) Reduction of tumor growth in Rag1−/− (closed square) or wild type mice (open square) was calculated relative to Ad5MOCK on day 12. (c) E.G7 tumors (1 × 10⁶ cells) in Rag1−/− mice were injected intratumorally twice at 7 day intervals with 5 × 10⁸ plaque forming units of Ad5MOCK (closed triangle), Ad5mTR (closed square), or Ad5mTR.sPD1 (closed circle). CD8 T cells (5 × 10⁴) from OT-1 mice were injected intravenously at the same time as the first adenovirus injection. Tumor growth was calculated and plotted at the indicated time points. Data represent the mean ± SEM (n = 6). P, unpaired t-test. (d) For ex vivo analysis of immune cells, E.G7 tumors in Rag1−/− mice were cotreated with CD8 T cells from OT-1 mice and the indicated adenovirus. Eight days after the first adenovirus injection, peripheral blood mononuclear cells were harvested from the mouse eye vein. Absolute numbers of OT-1 CD8 T cells were calculated from total numbers of live cells and percentages of TCR Vα2+, Vβ5+, T cells (OT-1 cells) in flow cytometry profile. P, Wilcoxon matched-pairs signed rank test.
