
Figure 6. Overexpression of CHK1 indicates a poor prognosis, and there is an inverse correlation between the protein levels of SYK(L) and CHK1 in HCC.
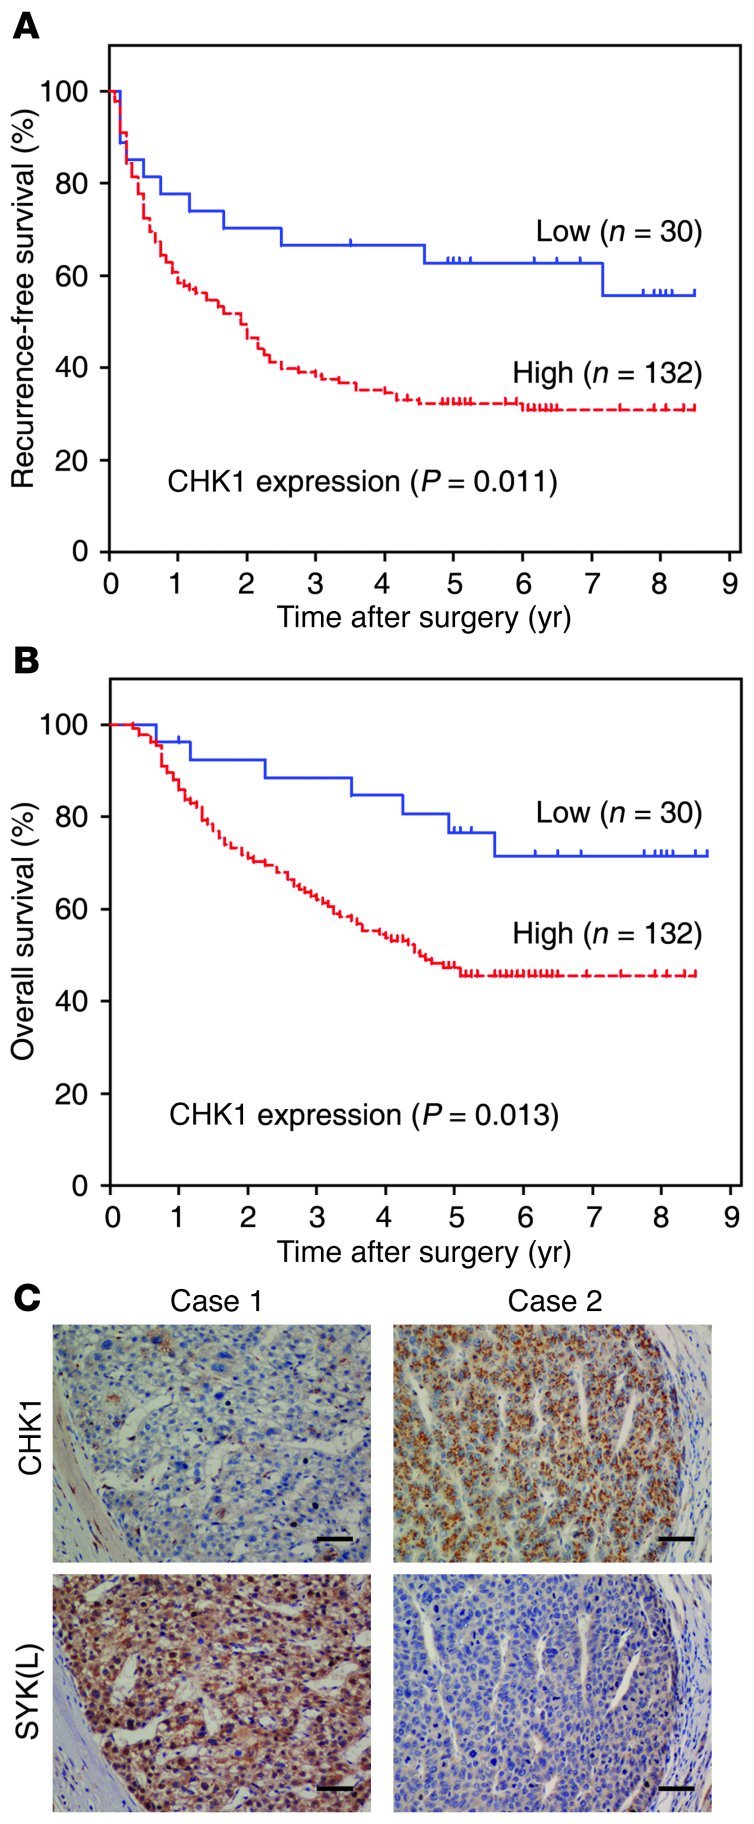
(A and B) RFS (A) and OS (B) curves were generated based on the CHK1 protein expression statuses from 162 HCC samples. Actuarial probabilities were calculated using the Kaplan-Meier method and were compared using the log-rank test. After resection of primary tumors, patients with low CHK1 expression in their primary tumors had better RFS and OS rates than those with high CHK1 expression (P = 0.011 and P = 0.013, respectively). (C) Immunohistochemical staining of CHK1 and SYK(L) was performed in tumor tissues of patients with HCC. Representative examples of CHK1 and SYK(L) staining in the serial sections from the same tumor tissues are shown. Scale bars: 50 μm. Data represent mean ± SEM.