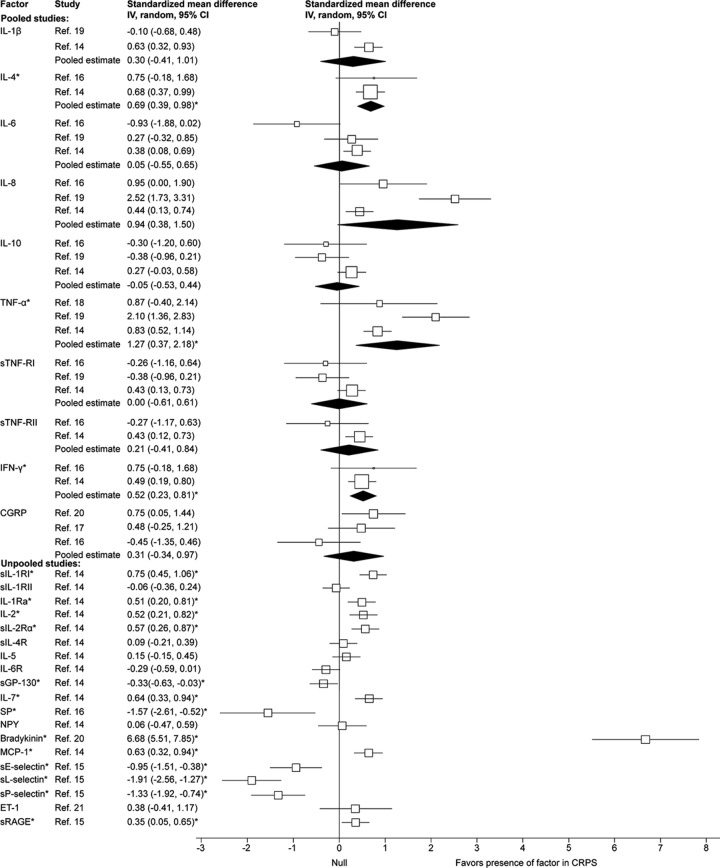
Figure 3. Forest plot of inflammatory factor effect sizes for blood samples from chronic complex regional pain syndrome cases compared with healthy controls.
Each study effect size (standardized mean difference) and weight is indicated by an open box and its 95% confidence intervals (CIs) are indicated by a horizontal line. The filled diamonds represent the overall effect size and CIs for each factor. Statistically significant outcomes are indicated by an asterisk. CGRP = calcitonin gene-relaxed peptide; ET-1 = endothelin-1; GP = glycoprotein; IFN = interferon; IL = interleukin; MCP-1 = monocyte chemoattractant protein-1; NPY = neuropeptide Y; SP = substance P; sRAGE = soluble receptor for advanced glycation end products; sTNF-R = soluble tumor necrosis factor receptor.

