FIG. 5.
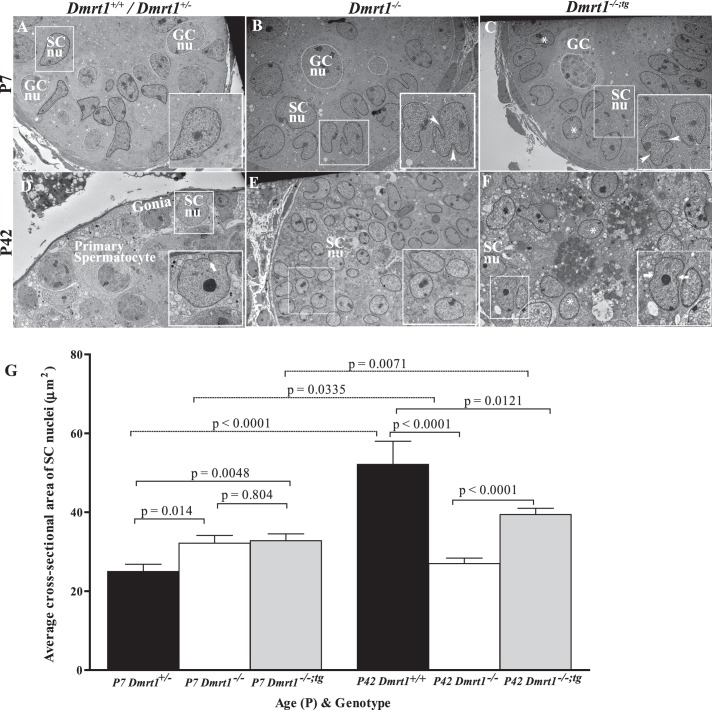
Electron microscopic evaluation of SC nuclei. Testes from Dmrt1+/+ or Dmrt1+/− (A and D), Dmrt1 −/− (B and E), and Dmrt1−/−;tg (C and F) mice were evaluated at P7 (A–C) and P42 (D–F). Some GC (GCnu) and SC nuclei (SCnu) are traced by white and black lines, respectively. A–C) Electron micrographs of seminiferous tubules from P7 Dmrt1+/−, Dmrt1−/−, and Dmrt1−/−;tg testes. A) Dmrt1+/− tubule showing normal ultrastructure of SC nucleus (inset). Magnification ×3040. B) Dmrt1−/− tubule showing abnormal SC nuclei. Boxed SC nuclei denoted the irregular shaped and multilobulated nuclei containing deep invaginations (arrowheads). Magnification ×3040. C) Dmrt1−/−;tg tubule showing a mixed population of normal- and abnormal-looking SC nuclei. The normal (asterisk) and abnormal (arrowhead) nuclei shared characteristics with Dmrt1+/+ and Dmrt1−/− mice, respectively. Magnification ×2280. D–F) Electron micrographs of seminiferous tubules from P42 Dmrt1+/+, Dmrt1−/−, and Dmrt1−/−;tg testes. D) Dmrt1+/+ tubule showing normal ultrastructure of SC and GCs. Note that SC nuclei are larger with considerable perinuclear cytoplasm and have an irregular ovoid shape with invaginations (arrow) and significant nucleolus. Magnification ×2280. E) Dmrt1−/− tubule showing SCs with many regular round nuclei (asterisk) and scanty amount of cytoplasm (inset). Note that there are no GCs present. Magnification ×1900. F) Dmrt1−/−;tg tubule showing many regular shaped, round SC nuclei (asterisk) with a few irregular, indented (arrows) nuclei, and prominent nucleolus. Magnification ×3040. G) The average cross-sectional area of SC nuclei in P7 and P42 testes of control (black bars), Dmrt1−/− (white bars), and Dmrt1−/−;tg (gray bars) testes. Graphed is the mean cross-sectional area of ≥60 nuclei per genotype per time point. Error bars represent the SEM. Statistical significance was determined using a two-tailed Student t-test with P-values denoted between relevant pairings.

