
Figure 4. Average methylation at each region examined in blood and myoblast cells of facioscapulohumeral muscular dystrophy (FSHD)2 and control individuals.
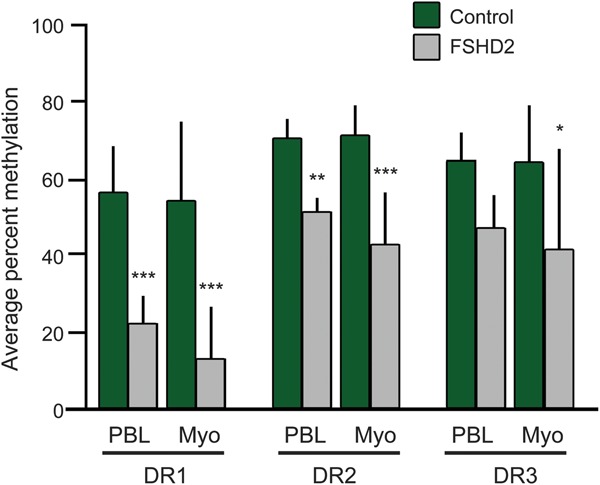
The percent methylation (y axis) of the averaged data for control compared with FSHD2 samples for blood DNA at each of the 3 tested sites (DR1–DR3) is shown. Differences between the means of control vs FSHD2 were tested using analysis of variance. The p values are as follows: DR1 peripheral blood lymphocyte (PBL) = 0.0002, Myo = 0.0002; DR2 PBL = 0.0019, Myo ≤0.001; DR3 PBL = 0.0749, Myo = 0.0300.