
Figure 1. Metabolic abnormalities in DYT11 mutation carriers regardless of symptoms.
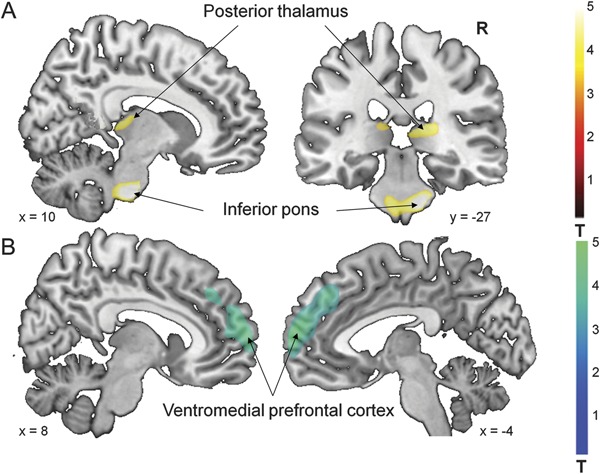
Statistical parametric maps (SPM) comparing [18F]-fluorodeoxyglucose PET scans from DYT11 mutation carriers to control subjects (table 2). (A) Increased regional metabolism was found in the inferior pons and posterior thalamus (table 2Aiii). (B) Decreased regional metabolism was found in the ventromedial prefrontal cortex (table 2Biii). (SPM{t} maps were superimposed on a single-subject MRI T1 template. Coordinates indicate the position of the slice in Montreal Neurological Institute standard space. The color scales represent t scores thresholded at t = 3.5, SPM corrected p < 0.05.)