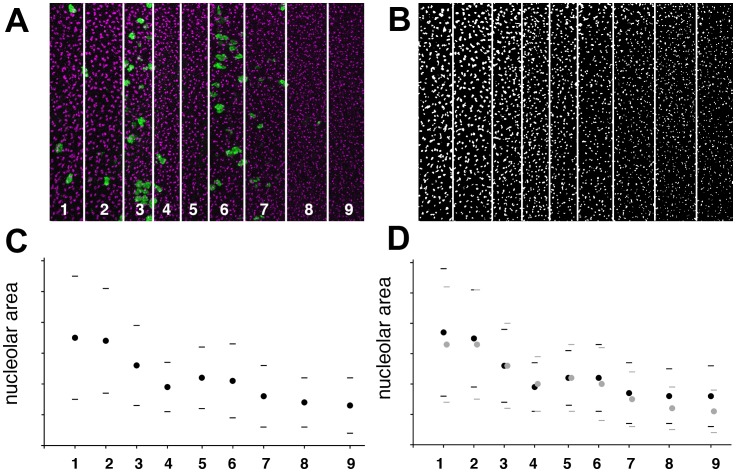
Figure 2. Timecourse of changes in nucleolus size.
A. High resolution micrograph of the eye imaginal disc, divided into nine zones from anterior to posterior, according to mitotic behavior (see text for details). Nucleoli labeled in magenta (anti-fibrillarin); mitotic figures labelled in green (anti-phosphoH3). B. Nucleolar labeling from panel A, z-projected from apical to basal within the disc epithelium and digitally processed for automated measurement (see methods). C. Nucleolus cross-section in pixels. Mean±1 standard deviation shown for each zone. D. Nucleolus cross-section in pixels. Mean±1 standard deviation shown. Within each zone, nucleoli from separated 3–5 μ deep apical or basal layers of the disc epithelium were analyzed separately (basal nucleoli: black circles; apical nucleoli, grey circles). These data were pooled in panel C.

