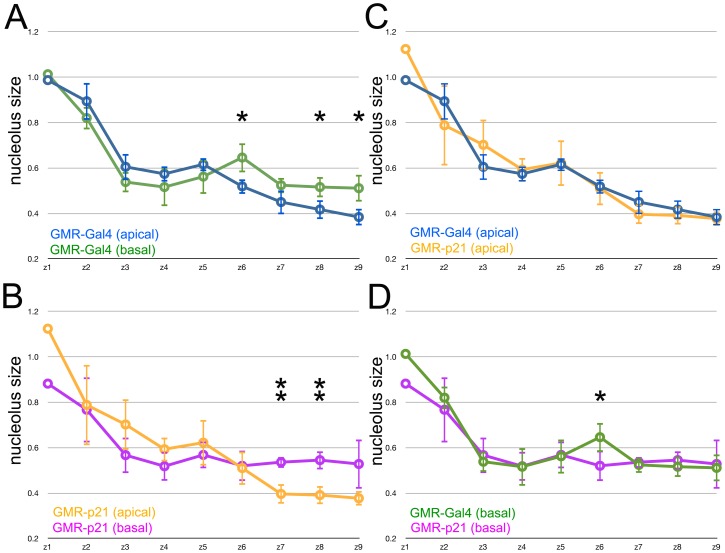
Figure 3. Effect of p21Cip1/WAF1 expression on nucleolus size.
Nucleolus size over time. Data shown are mean and standard deviations of the average nucleolus size from each Zone, normalized to Zone 1 from the same eye disc. Statistical significance between samples: *, p<0.05; **, p<0.01; ***, p<0.001. A. Blue - cells with apical nuclei in GMR-Gal4/+; Green - cells with basal nuclei in GMR-Gal4/+. Nucleoli from unspecified cells with basal nuclei were significantly larger in Zones 6, 8 & 9. B. Orange - cells with apical nuclei in GMR-p21; Magenta - cells with basal nuclei in GMR-p21. Nucleoli from unspecified cells with basal nuclei were significantly larger in Zones 7 & 8. Note that nucleolar sizes did not differ in Zone 6. C. Comparison of apical nucleoli from GMR-Gal4/+ (blue) and GMR-p21 (orange). No significant differences were noted. D. Comparison of basal nucleoli from GMR-Gal4/+ (green) and GMR-p21 (magenta). Basal nucleoli from GMR-p21 were significantly smaller in Zone 6.

