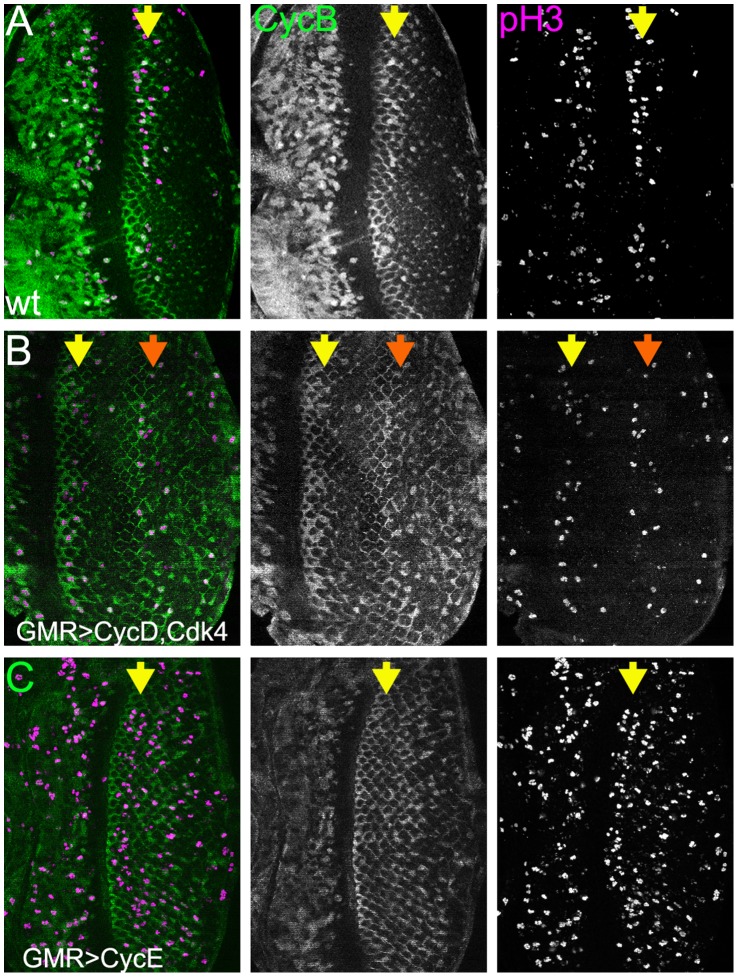
Figure 4. Proliferation induced by Cyclin overexpression.
All panels show Cyclin B protein in green as a marker for cells between S-phase and mitotic metaphase, and pH3 in magenta as a marker for mitotic cells. The yellow arrow indicates the Second Mitotic Wave in all figures. A) wild type. Most Second Mitotic Wave mitosis occurs in a band close to the morphogenetic furrow. B) GMR-GAL4, UAS-CycD, UAS-Cdk4. The Second Mitotic Wave is followed by a fairly synchronous additional cell cycle approximately 8 columns more posteriorly. The peak of mitosis in this “Third Mitotic Wave” is indicated by the orange arrow. The Second and Third Mitotic Waves are clearly separated by a zone where most cells are in G1 phase and lack Cyclin B. C) GMR-GAL4, UAS-CycE. The Second Mitotic Wave is followed by generalized and apparently unsynchronized proliferation of interommatidial cells.

