
Figure 2. Bitter tastants reverse Mch-induced increase in [Ca2+]i and cell shortening in mouse ASM.
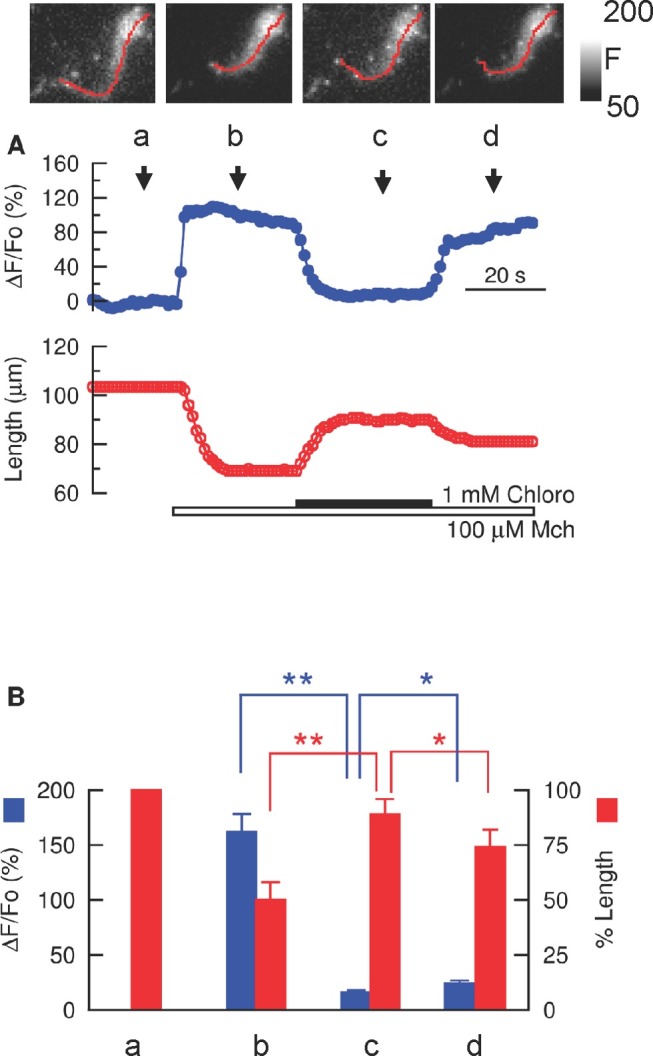
(A) Time course of the effect of chloro (1 mM) on a 100 µM Mch-induced increase in [Ca2+]i (represented as ΔF/F0 integrated over the entire cell) and cell shortening. Images show the changes in [Ca2+]i displayed as fluorescence intensity (rather than ΔF/F0 to aid visualization). Cell length is indicated by the red lines. Images were taken at the time indicated on the time course of [Ca2+]i (upper panel). (B) Relationships between [Ca2+]i (left axis, blue bars) and cell length (right axis, red bars) in response to Mch and Chloro. The letters correspond to the time shown in the upper panel in (A) (n = 23 cells, mean ± SEM; *p<0.05, **p<0.01 using two-tailed Student's t-test). ΔF/F0 is zero by definition at a, so no blue bar is present at a.