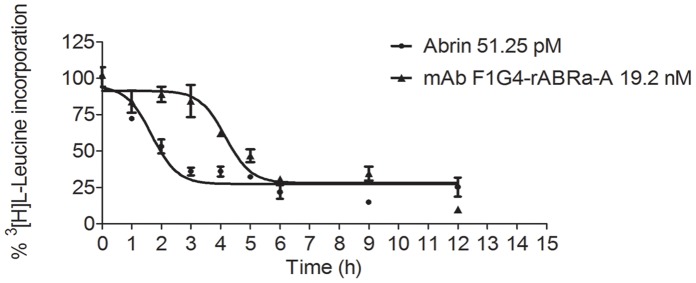
Figure 2. Kinetics of inhibition of protein synthesis by F1G4-IT is slower than that of abrin.

HepG2 cells (1×10⁶/ml) were treated with IC90 of either abrin or F1G4-IT for different time intervals and the procedure followed as described in Figure 1. The Boltzmann curve was used to analyze the data. The graph represents the mean of three separate experiments carried out with duplicate samples.
