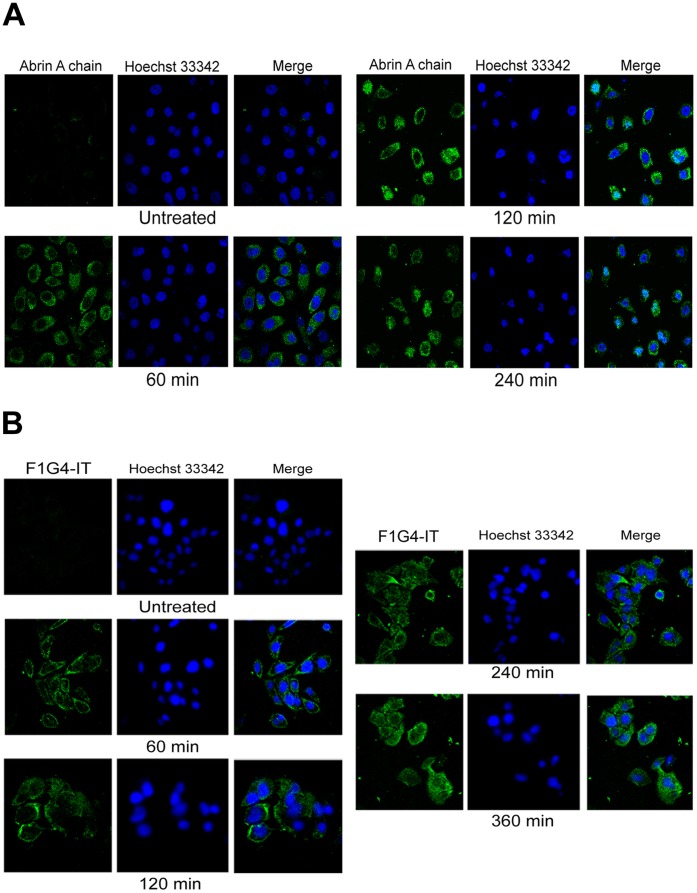
Figure 4. Intracellular localization of F1G4-IT in HepG2 cells is different from that of abrin.
Cells (5×10⁶) treated with either abrin or F1G4-IT for different time intervals were fixed with 4% para-formaldehyde and stained with mAb D6F10-Alexa 488 for 2 h in the dark at RT. The cells were counter stained with 5 µg/ml of Hoechst 33342 for 10 min at RT, washed with PBS, mounted on slides and images acquired in the Zeiss confocal scanning microscope. The images were analysed using the Image J image browser. Confocal microscopy of, A: abrin treated cells; B: F1G4-IT treated cells.

