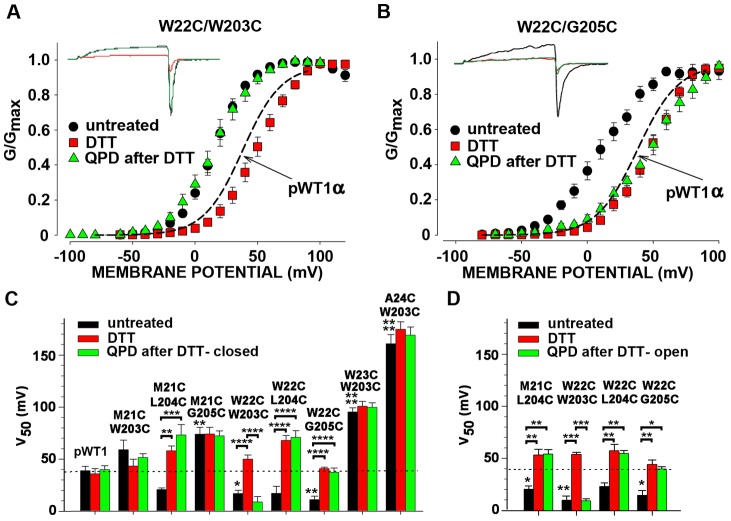
Figure 2. Effects on V50 of endogenously formed S0-S4 disulfide bonds, their reduction, and their QPD-induced reformation at the cell surface.
(A, B) Macroscopic currents (insets) and normalized G-V curves of untreated cells expressing W22C/W203C (A) or W22C/G205C (B), after treatment with 10 mM DTT (pH 7.5) for 5 min, and after subsequent treatment with 40 μM QPD (pH 7.5) for 2 min. Recordings were from outside-out macropatches with 10 μM Ca2+ inside the pipette. At each potential, the mean relative conductance averaged from several cells is plotted. The mean G-V curve for pWT1 α is shown as a dashed-line. (C) Mean V50 ± SD of the V50s from the individual fits of the Boltzmann equation to the currents from each cell. The V50s were determined after endogenous disulfide crosslinking (black bars), after subsequent DTT (red bars), and finally after 40 μM QPD (green bars). The mean V50 for pWT1 α is shown as a dashed-line. In C, the macropatches were held at −100 mV (closed state) during the QPD-induced reoxidation. N = 3–11. (D) As C, except that the patches were held at +80 mV (open state) during the application of QPD. The mean V50 for pWT1 α is shown as a dashed-line. * P<0.05, **P<0.01, *** P<0.001, **** P< 0.0001 by one-way Anova followed by Tukey’s post-hoc analysis for multiple comparisons between brackets. Without brackets, comparison to pWT1 αby one-way Anova followed by Tukey’s post-hoc analysis.

