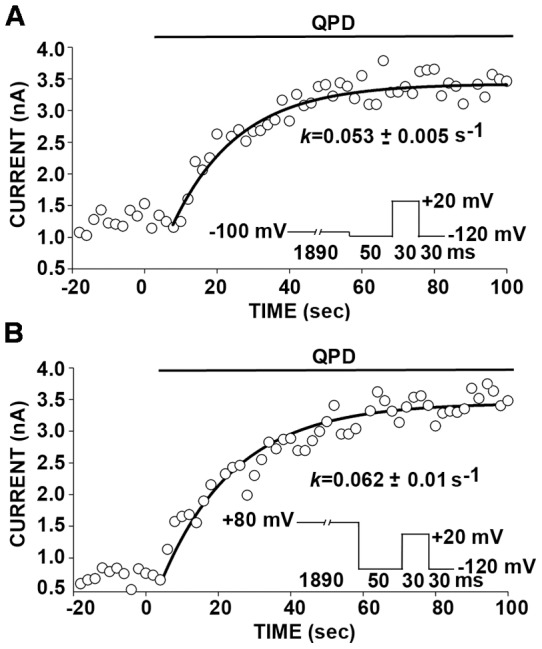
Figure 3. Kinetics of reformation of disulfide bond between W22C and W203C in the closed state (A) and in the open state (B).

Outside-out patches were bathed in 10 mM DTT (pH 7.5) for 5 min. During the subsequent application of 40 μM QPD, membrane potential was held for 1890 ms at either −100 mV (A) or +80 mV (B). After 50 ms at −120 mV, the patch was depolarized to +20 mV for 30 ms and hyperpolarized to −120 mV for 30 ms, during which the tail current was recorded. This cycle, represented in the insets, was repeated every 2 s. The peak amplitudes of the tail currents are plotted against elapsed time. The data were fit with a single exponential function. The means of the rate constants from the least-squares fits of 5 independent experiments are given under the curves. The pipette solution contained 10 μM Ca2+. N = 4 for closed state and n = 5 for open state. P = not significant by unpaired Student’s t-test.
