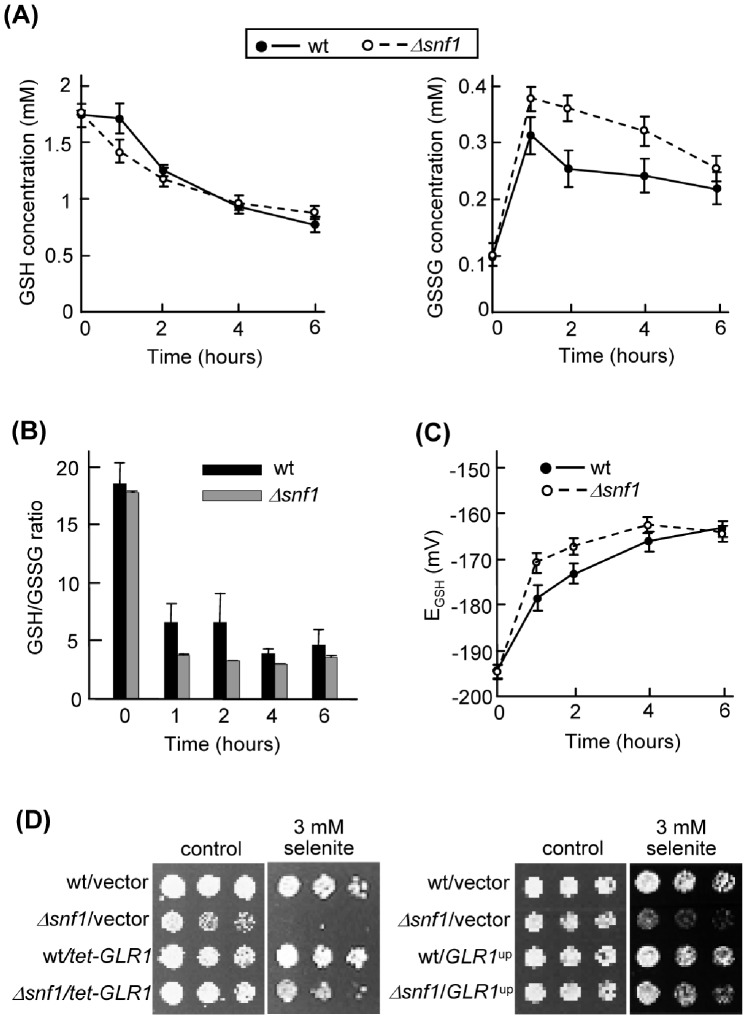
Figure 6. The ratio of reduced vs oxidized glutathione is altered upon selenite treatment.
(A) Intracellular concentration of GSH (left) and GSSG (right) in cells treated with 2 mM sodium selenite for the indicated times. Wild type (W303-1A, continuous lines) and mutant Δsnf1 (Wsnf1, dashed lines) cells were grown in SC medium. Values (± s.d.) are the mean of three independent experiments. (B) GSH/GSSG ratio as determined from the concentration values shown in part (A). (C) GSH redox potential (EGSH) in wild type (continuous lines) and mutant Δsnf1 (dashed lines) cells treated with selenite. EGSH was calculated from the GSH and GSSG concentration values in each of the three experiments indicated in part (A), using the Nernst equation for the GSH/GSSG pair. The mean (± s.d.) is represented. (D) Growth assays in SC medium of serial dilutions of the strains indicated in part (A) transformed with vector pCM189 or its derivative pMM1039 (tetO-GLR1), or of the same strains transformed with the multicopy vector YEplac195 or its derivative P1116 overexpressing GLR1 (right panels).

