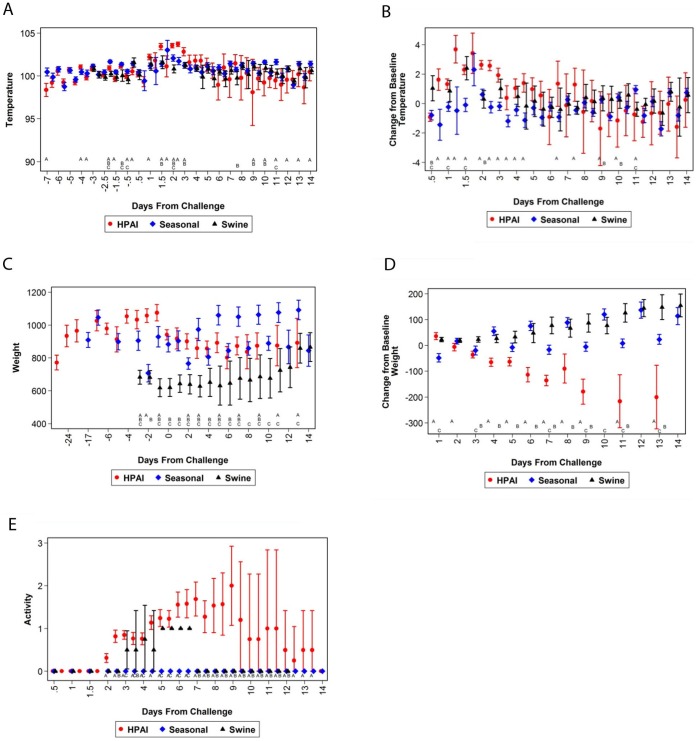
Figure 2. A comparison of temperature, weight, and activity of influenza-infected ferrets.
A statistical comparison was performed on ferrets infected with HPAI, seasonal, or swine influenza virus: (A) temperature, (B) change in temperature from baseline, (C) weight, (D) change in temperature from baseline, and (E) activity. A represents a significant difference when comparing HPAI and seasonal influenza; B represents a significant difference when comparing HPAI and swine influenza; and C represents a significant difference when comparing swine influenza and seasonal influenza. The error bars represent the 95% confidence intervals.

