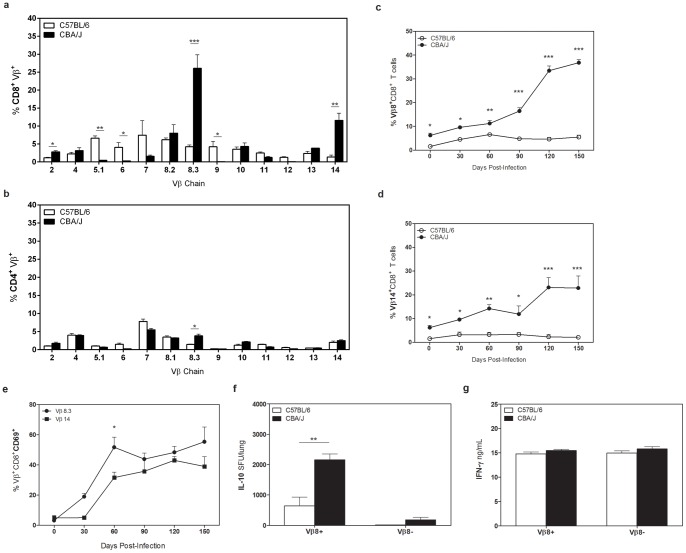
Figure 4. Vβ TcR expression in CBA/J and C57BL/6 mice.
C57BL/6 and CBA/J mice were infected with an aerosol dose of Mtb and at various timepoints post-infection lungs were removed and processed for flow cytometry. Percentages of CD8+ (a) or CD4+ (b) T cells expressing specific Vβ TcRs at day 120 post-infection. Percentages of CD8+ T cells expressing Vβ8 (c) or Vβ14 (d) TcR over the course of Mtb infection. (e) Percentages of Vβ8+ or Vβ14+ CD69+CD8+ pulmonary T cells over time. (f) Vβ8+ and Vβ8neg T cells from day 120 post-infection were cultured for 72 hr with anti-CD3/CD28 and IL-10 SFU determined by ELISpot. (g) Supernatants from (a) were analyzed for IFN-γ levels by ELISA. Data representative of at least two independent experiments with 4 mice per group per timepoint. * p<0.05, ** p<0.01, *** p<0.001 as obtained by Student's t test.

