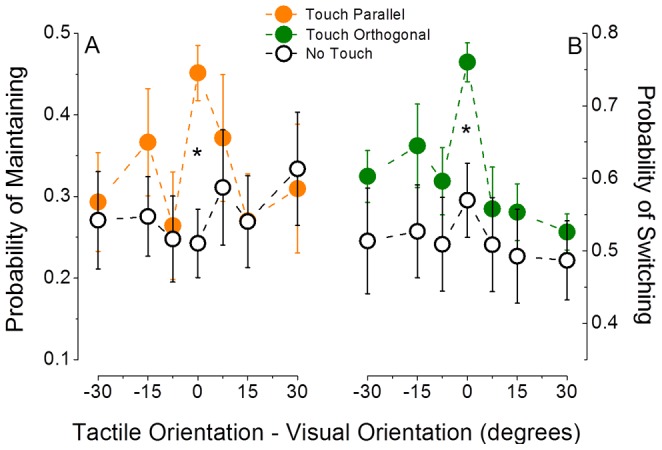
Figure 2. Orientation tuning of the probability of maintaining and switching perception during parallel or orthogonal visuo-haptic stimulation compared to no-touch periods.

The probability of maintaining the same visual stimulus during the whole touch period when visuo-haptic stimulation is parallel (Panel A, orange symbols) and the probability of switching perception when visuo-haptic stimulation is orthogonal (Panel B, green symbols), compared to no-touch periods (open symbols) are plotted as a function of the mismatch in orientation between the visual and the haptic gratings (defined as haptic orientation – visual orientation). Both probabilities significantly differ from no-touch periods only when visual and haptic stimuli are perfectly matched in orientation (paired t-test, two-tailed, df = 7, p≤0.05).
