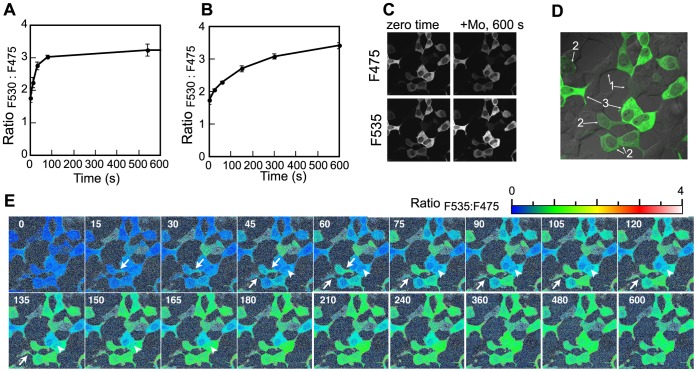
Figure 3. Real time imaging of molybdate level in living animal cells. A.
, Time course of RF530:F475 in bulk HEK-293T cells transfected with MolyProbe after exposure to 1 mM molybdate at 37°C. B, Time course of RF530:F475 in the bulk cells treated with 1 mM molybdate at 22°C. Averages and SDs from triplicate samples are shown. C, Confocal CFP(F475) and YFP(F535) images of the cells before and after treatment with 1 mM molybdate. D, Variation in expression levels of MolyProbe. A density image of MolyProbe (green) calculated from a pair of CFP and YFP image was merged with a transmission image (grey). Low-level expression cells (1), middle-level cells (2) and high-level cells (3) showed a different time course of the ratio change (Figure E). E, A series of ratio images of the cells accumulating molybdate. Ratio (F535:F475) images were calculated from pairs of CFP and YFP images taken every 15 sec, and the ratios are presented in pseudo-color. Intracellular molybdate increased by addition of 1 mM molybdate to the medium. Velocity of the molybdate increment in pseudopod was fast compared to the cell body (arrow), whereas nuclear space was slow (arrowhead).

