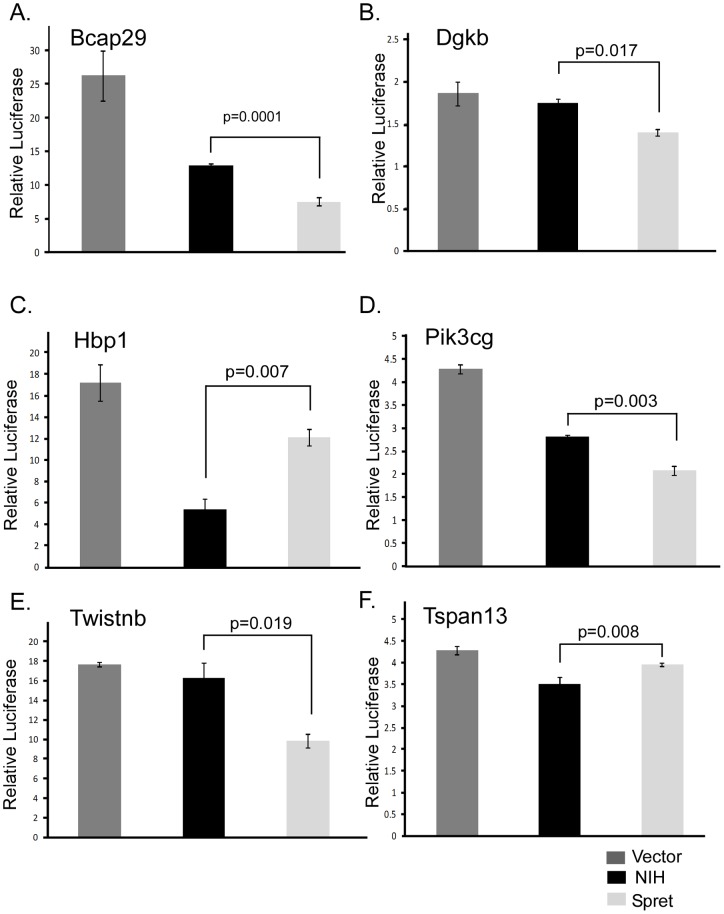
Figure 1. Luciferase assays for 3′UTRs of SPRET/Outbred and NIH/Ola.
Representative relative luciferase units normalized to mock for the pGL3 luciferase vector (dark gray), NIH 3′UTR (Black) and SPRET/Outbred 3′UTRs (light gray) for six genes are shown. P-values of differential expression between NIH/Ola and SPRET/Outbred are indicated. A. Bcap29; B. Dgkb; C. Hbp1; D. Pik3cg; E. Twistnb; F. Tspan13.

