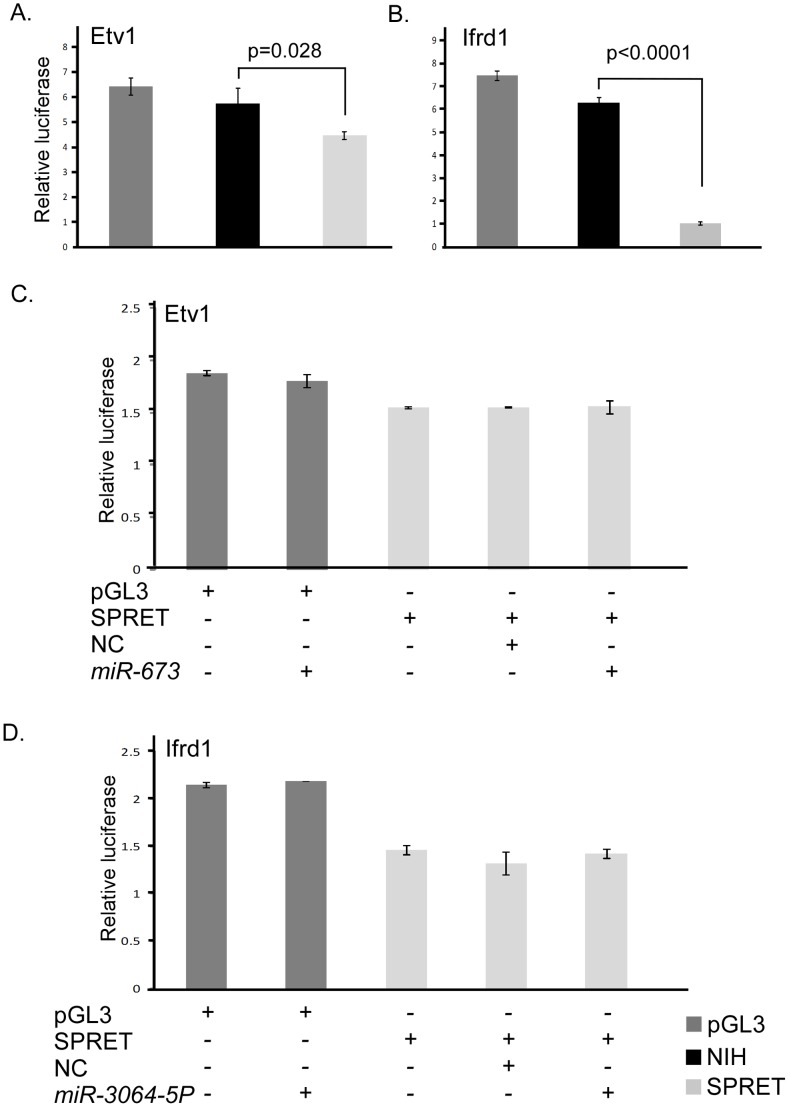
Figure 5. Luciferase and mRNA results of Etv1 and Ifrd1.
Representative relative luciferase units normalized to mock for the pGL3 luciferase vector (dark gray), NIH 3′UTR (Black) and SPRET/Outbred 3′UTRs (light gray) for A. Etv1 and B. Ifrd1 are shown. Representative experiments showing no effect of miRNA on luciferase expression for the predicted SPRET/Outbred target for C. Etv1 and miR-673 and D. Ifrd1 with miR-3064-5P. ApGL3, pGL3 luciferase vector without insert; NIH, NIH/Ola 3′UTR; SPRET, SPRET/Outbred 3′UTR; NC, scrambled control miRNA, Dark Gray bars, pGL3 luciferase vector; Black bars, pGL3 vector with the NIH/Ola 3′UTR; Light gray bars, pGL3 vector containing the SPRET/Outbred 3′UTR.

