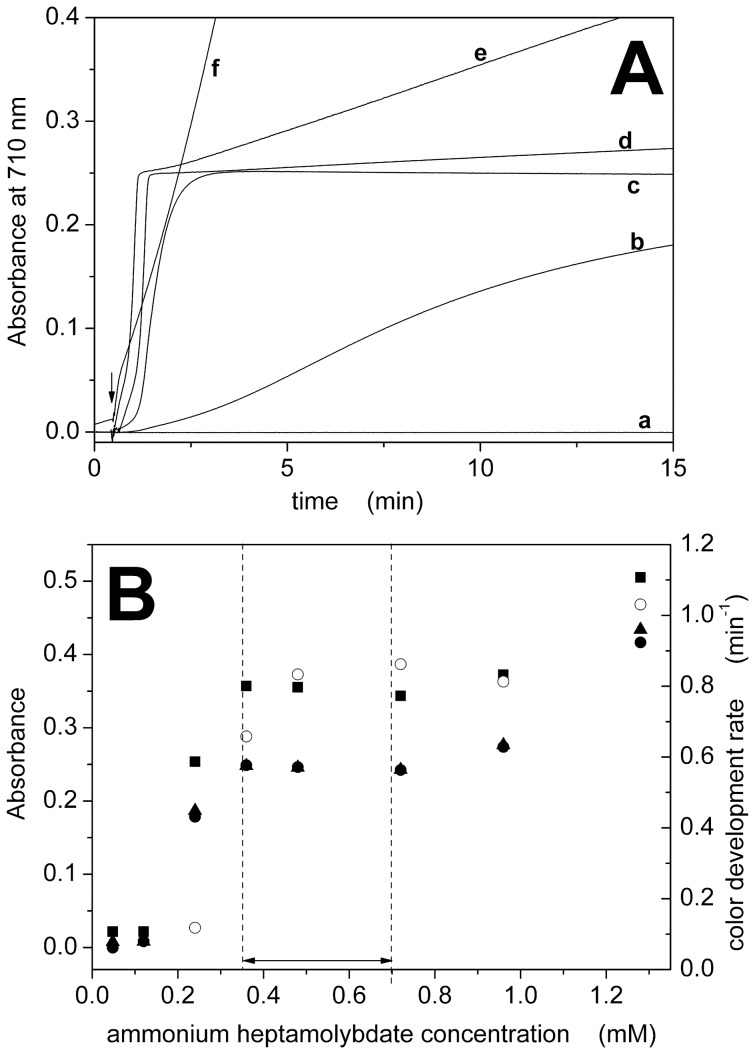
Figure 2. Dependence on ammonium heptamolybdate concentration.
(A) Color development curves measured at 710 nm in the presence of different concentrations of ammonium molybdate: 0.048 mM (a), 0.24 mM (b), 0.36 mM (c), 0.96 mM (d), 1.28 mM (e) and 4.8 mM (f). Inorganic phosphate (15 nmol) was added where indicated by the arrow. (B) Dependence of absorbance (•, ▴, ▪) or color development rate (○) on ammonium heptamolybdate concentration. Absorbance data were taken from the development curves at t = 15 min (•) or from the visible spectra (Fig. S2) at 710 nm (▴) and 890 nm (▪). The optimal concentration range is indicated by the dashed lines (Table 1).

