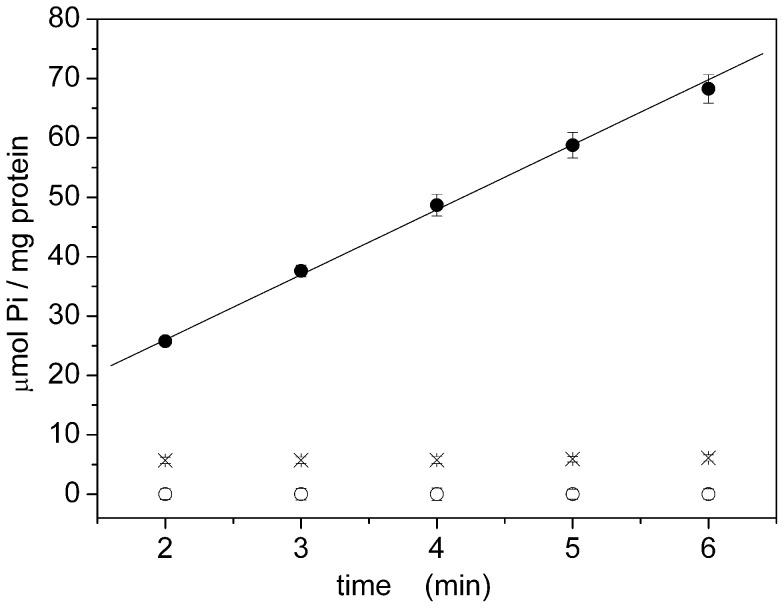
Figure 8. Hydrolytic activity of native Na,K-ATPase.
Enzymatic activity of native Na,K-ATPase determined in the presence of sodium ions (•, X). Background activity in the absence of sodium ions (○) or in the presence of 50 µM ouabain (X) are also shown. The solid line represent the linear fitting (Y = A+BX) of the experimental data: A = 4 ± 1 µmol Pi/mg; B = 10.9 ± 0.5 µmol Pi/(mg·min). Error bars represent the standard deviations of three measurements. Elapsed time: 30 minutes.

