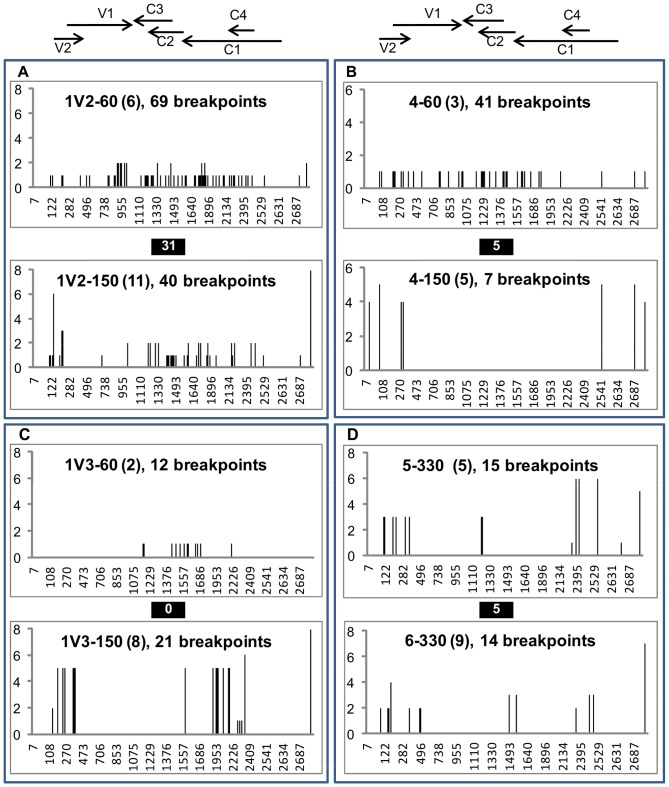
Figure 4. Distribution of recombination breakpoints detected in viral genomes isolated from tomato plants co-infected with TYX and TOX.
Recombinant genomes were isolated from tomato plant co-infected with Tomato yellow leaf curl virus (TYX) and Tomato leaf curl Comoros virus (TOX) and sampled at 60, 150 and 330 days post inoculation (dpi) as reported in Figure 1. The distributions of recombination breakpoints are compared between genomes isolated at 60 dpi and 150 dpi from plants 4, 1V2 and 1V3 (A, B, C, respectively). Similarly, the distribution of breakpoints was compared between plants 5 and 6 at 330 dpi (D). The breakpoints are presented on a genome linearized at the virion strand origin of replication and were located according to the nucleotide positions on the genome (x-axis). The positions of the six open reading frames (V1, V2, C1, C2, C3 and C4) are given at the top. The numbers in brackets indicate the numbers of genomes analyzed in each sample, followed by the number of distinct breakpoints among these genomes. The number of common breakpoints detected between recombinant genomes sampled from the same plant at two dates (A-C) or between two 330 dpi plants (D) is shown in black boxes. The y-axis indicates the number of genomes in which each breakpoint was detected.

