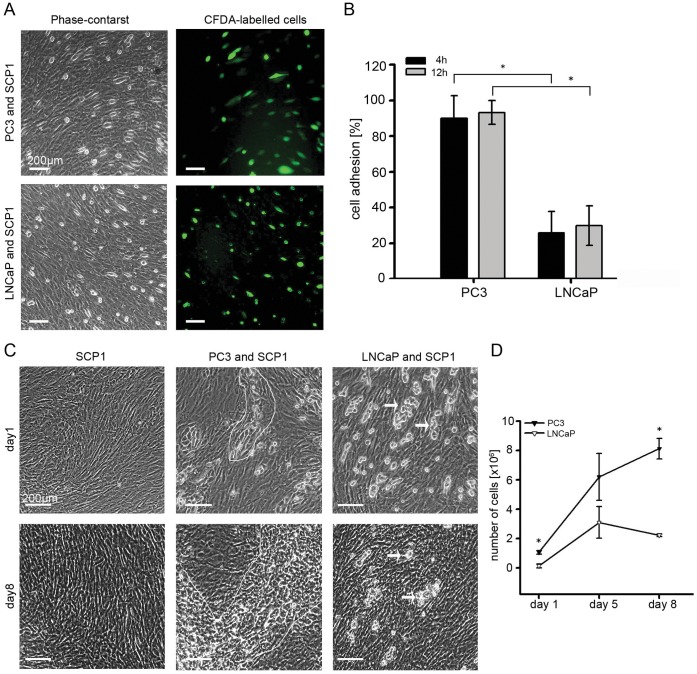
Figure 1. Cell adhesion and expansion of PC3 and LNCaP cells on SCP1 monolayers.
(A) Phase-contrast and fluorescent microscopy of CFDA-labelled PC3 and LNCaP cells plated on SCP1 monolayers in 6-well dishes. Images are taken after 4 h. (B) Quantification of adherent PC3 and LNCaP cells after 4 and 12 h cultivation on SCP1 monolayers. The percentage of adherent cells was quantified first, by manual counting of the CFDA-labelled cells with the cell counter tool in Image J software and second, by comparing to the initial number of plated cells (5×10⁵ cells/well). In the images also a slight background of CFDA dye particles is visible (more apparent in the LNCaP image). The analyses revealed that already at 4 h PC3 cells completely adhered on SPC1 cells while LNCaP cells had a significantly lower adhesion rate at 4 h and 12 h. The graph bars show mean ± SD of four independent experiments (p<0.0001, unpaired t-test). (C) PC and LNCaP cells (2×10⁵ cells/well) were grown on SCP1 monolayers in 6-well dishes for up to 8 days. Phase-contrast images demonstrated the formation and propagation of PC3 colonies (outlined) on the top of SCP1 cells between day 1 and 8. In contrast, LNCaP cells formed small cell clusters (arrows) that did not expand but rather regressed by day 8. (D) Quantification of PC and LNCaP cell numbers after 1, 5 and 8 days of cultivation on SCP1 monolayers. The proliferation of PC3 and LNCaP cells was calculated by subtracting the SCP1 control monolayers from the total cell count of the co-culture. Similarly to the microscopy data, the quantitative analysis confirmed that PC3 cells but not LNCaP were able to divide and further expand on SCP1 cells. The graph shows mean ± SD of three independent experiments for each time point (p<0.0001, unpaired t-test).

