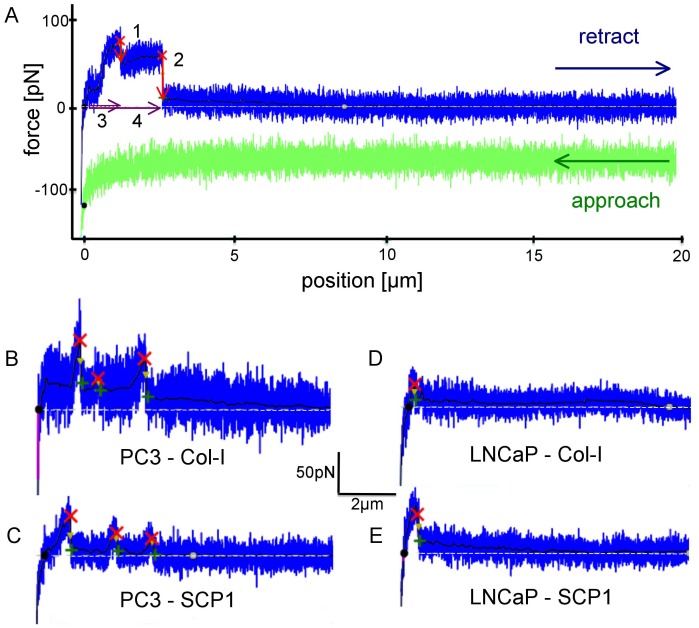
Figure 3. Representative force-distance curves: in green the approach of the force sensor with a prostate cancer cell to the substrate and in blue the retraction (for clarity the blue curve is shifted by approximately 50 pN with respect to the green curve).
The lowest data point to the left marks the contact force of 100 pN; the white dotted line represents the baseline intersecting the retrace curve at the black circle defining the cell surface; the black line is the de-noised signal and the red crosses indicate detected de-adhesion steps where the adhesion force evaluation takes place. (A) Force curve from a PC3-cell interacting with Col-I for illustrating the adhesion force evaluation: Red arrow #1: step height of the first de-adhesion event in the retraction curve. The detachment force is the absolute measure from the red cross down to the base line; #2: step height of the second de-adhesion event after a force plateau of 0.9 µm in length; #3: step position of the first de-adhesion event; #4: step position of the second de-adhesion event. (For definitions see Cell Adhesion Force Evaluation in the Materials and Methods section). Characteristic curves from each of the four different types of experiments are represented: (B) PC3 on Col-I, (C) PC3 on SCP1 monolayer, (D) LNCaP on Col-I and (E) LNCaP on SCP1 monolayer.

