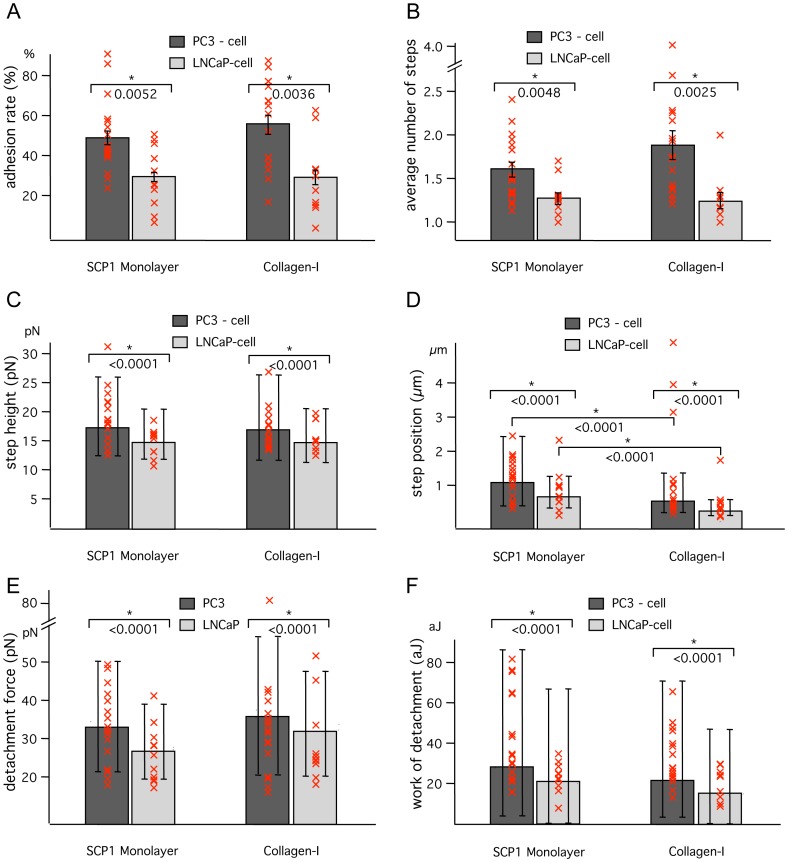
Figure 4. Cell adhesion AFM force spectroscopy measurements of PC cells with Col-I and with SCP1 monolayer.
(A) Percentages of force curves with at least one de-adhesion event. (B) Number of de-adhesion events within one adhesive curve. Error bars correspond to standard error of the mean. A significant p-value from an unpaired t-test of the PC3 data with respect to the LNCaP data is marked by *(p<0.05). The mean of each individual cell is given by a red cross. (C) Medians of the height of individual de-adhesion steps. (D) Medians of the position of these de-adhesion events. (E) Medians of the detachment force. (F) Medians of the work of detachment. Quartiles are indicated by double flags and the median of each individual cell is given by a red cross. Cell adhesion force data were acquired from 16 PC3 or 10 LNCaP cells interacting with Col-I (1485 and 760 force curves respectively), and 17 PC3 or 11 LNCaP cells interacting with SCP1 monolayers (1526 and 878 force curves respectively).

