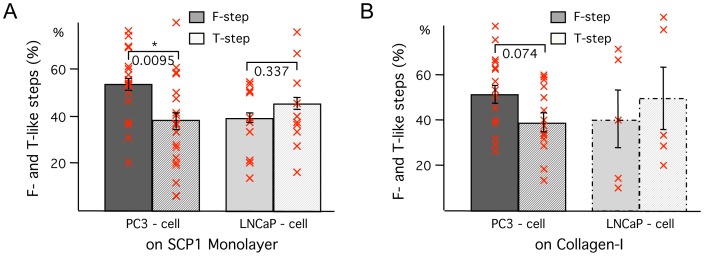
Figure 5. Analysis of filopodia-like steps versus tether-like steps in both cancer cell types to (A) SCP1-monolayers (from more than 600 force curves each) and to (B) collagen-I (from more than 500 PC3 curves but only 54 LNCaP curves; the bars for the LNCaP cells are therefore indicated by dashed lines).
Means of the percentage of individual de-adhesion steps representing the typical force pattern of filopodia-like steps (solid) and tether-like steps (striped) for the two cell lines PC3 and LNCaP. Each mean of a cell is represented by a red cross. Error bars correspond to standard error of the mean. A significant p-value from a t-test between the different steps within a prostate carcinoma cell line is indicated by *(p<0.05).

